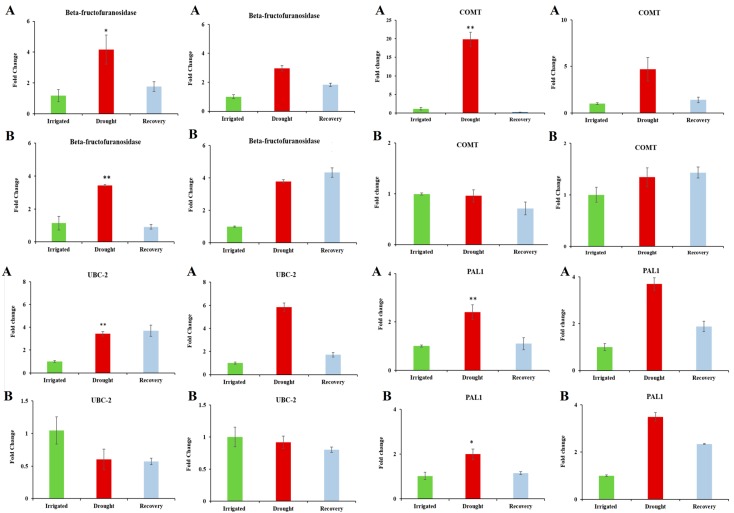
Figure 3.
Comparison of qPCR and microarray intensity values: Rows (A) and (B) respectively refer to results for DipC and TN. The left- and right-hand pairs of columns correspond to the qPCR and microarray values for DipC and TN, respectively. The gene under study is named at the top of each panel. In order, the investigated genes are Beta-fructofuranosidase, COMT, UBC-2, and PAL1. qPCR and Microarray values are shown as fold changes with respect to the water-sufficient treatment (Irrigated). Error bars denote the standard error. Single and double asterisks indicate that p-value is less than 0.05 and 0.01, respectively, which was assessed by the paired t-test between groups. Irrigated and Drought refer to water-sufficient and water-limited treatments, respectively.

