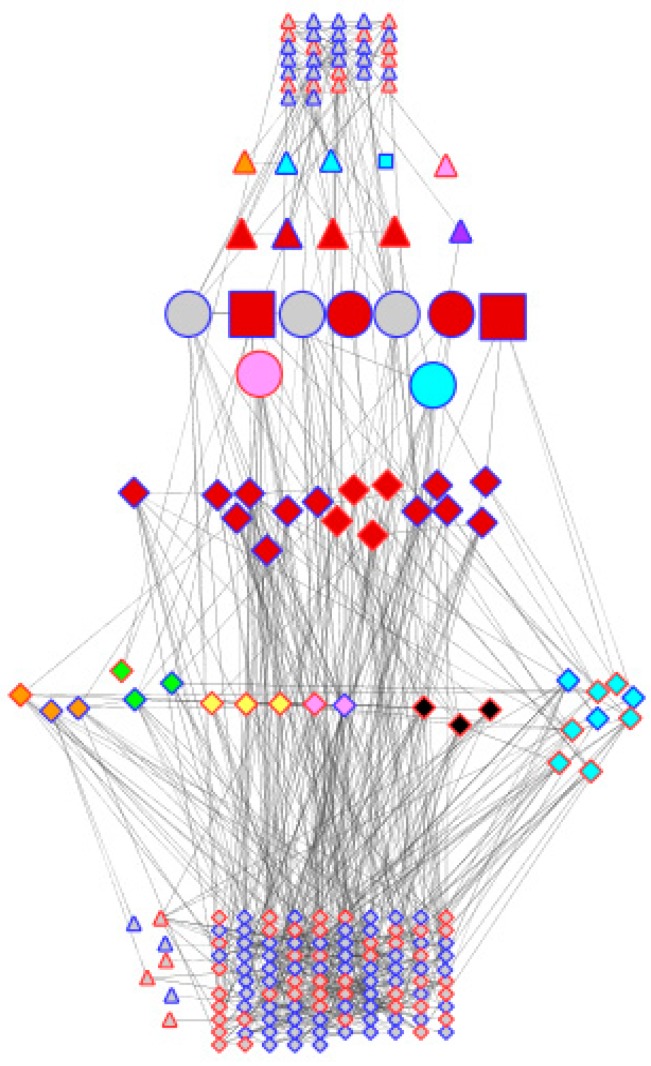
Figure 4.
Comparison of genotype co-expression networks. Cytoscape has been used to layout the merged dehydration-responsive network of co-expressed probe-sets. Node shapes are triangles, diamond circles, and squares, respectively, for the differential expression of the probe-sets of TN, DipC, both (i.e., common), and both but affecting stomata. They have been coloured according to their activity in relation to the dehydration response: red (transcription), orange (cell wall), yellow (lignin synthesis), green (photosynthesis), blue (transporters), indigo (hormone signalling), pink (osmoprotection), black (oxidative stress), and grey (others). Node borders have been coloured red and blue to denote up- and downregulation under stress. Nodes have been arranged in seven horizontal bands with probe-sets in common in the middle flanked by TFs and hormone-signalling genes, other genes that play various roles in response to dehydration, and others. Nodes have been linked by the criteria of the co-expression analysis.

