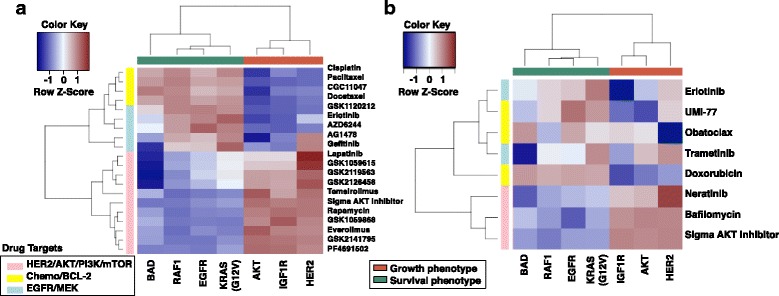
Fig. 5.

Growth factor receptor network phenotypes reflect dichotomous drug response in breast cancer cell lines. Colors correspond to scaled Spearman correlations between specific pathway activation estimates generated with ASSIGN and drug sensitivity (−logGI50) across a 55 breast cancer cell lines from the ICBP panel and b 23 breast cancer cell lines in an independent drug assay. Red represents positive correlation and blue represents negative correlation. Pathways cluster across the x-axis as AKT growth phenotype (coral color) and EGFR growth phenotype (green). Drug classes are represented along the y-axis: pink, HER2/AKT/PI3K/mTOR-targeted therapies; yellow, chemotherapies/BCL-2 targeting therapies; and blue, EGFR/MEK-targeted therapies
