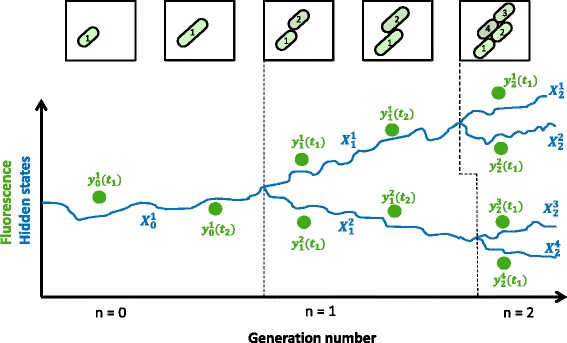
Fig. 1.

Graphical illustration of the observed and unobserved system dynamics in the lineage tree setting. A hypothetical time-lapse microscopy experiment, in which time-lapse microscopy images of a growing E.coli colony are obtained. The strain contains a fluorescent reporter gene. After the cells are segmented and tracked, the fluorescence intensity in each of them can be extracted, giving rise to a fluorescence lineage dataset (green dots). The continuous blue curve represents the unobserved state trajectory of each individual cell. Subscripts on measurements and states denote the generation number, while superscripts index the cells of each generation
