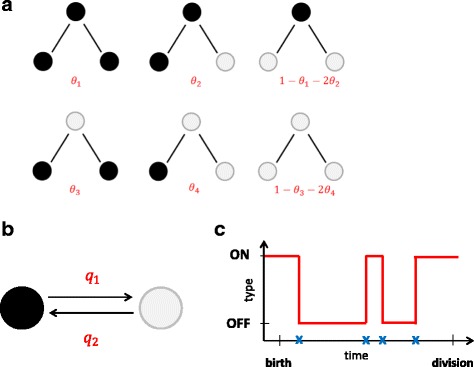
Fig. 2.

Graphical illustration of the two systems considered. a Model 1: All possible daughter pairs from a single mother and the corresponding probabilities of obtaining those pairs. The cells can be found in two possible states OFF (black) and ON (white). Note that the probability of the first daughter cell being OFF and the second ON is equal as the probability of the first daughter being ON and the second OFF. b Model 2: Cell types switch during the cell lifetime according to a two state continuous-time Markov chain with rates q 1 and q 2, c Model 2: An example of the evolution of a cell type during its lifetime. The blue crosses on the time axis indicate switching point from ON-OFF or vice versa
