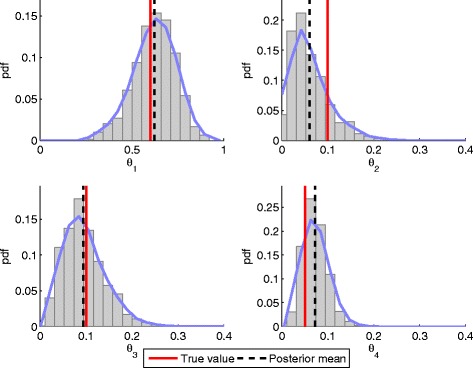
Fig. 3.

The proposed algorithm successfully infers parameters involved in the cell division process. Posterior distributions of the inferred parameters described in Example 1. The posteriors were obtained using 16,604 samples, after 2000 burn-in samples had been discarded. The red vertical bar is positioned at the true parameter value (the one used for data generation), while the black dashed line is positioned at the estimated posterior mean. The blue curves are obtained by smoothing of the normalized histograms of the samples
