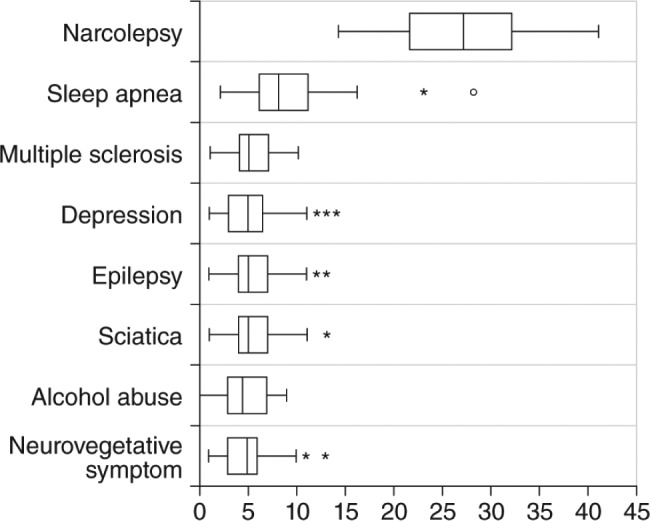
Figure 2. Box plot graphics of the Ullanlinna Narcolepsy Scale score distributions in patients with narcolepsy (mean 27.3; 95% confidence interval 24.4–33.1; range 14–41) and 7 comparison groups.

The box represents the interquartile range (IQR) and the median is marked by the central vertical line. The horizontal line segments indicate values falling within 1.5 IQRs from the box. Asterisks indicate outside values and open circles indicate far outside values (> 3 IQRs from box). Reprinted from Journal of Sleep Research, Vol 3(1), Hublin C, et al. The Ullanlinna Narcolepsy Scale: validation of a measure of symptoms in the narcoleptic syndrome, pages 52-59, Copyright 1994, with permission of John Wiley & Sons, Inc.44
