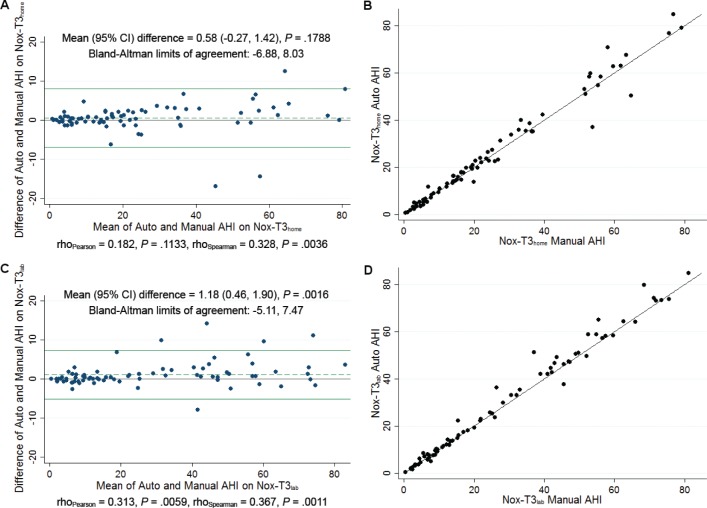
Figure 3. Comparison of automatically scored AHI to manually edited AHI on HSAT and in-laboratory portable monitor recording.
(A) Bland-Altman plot comparing automatically scored AHI to manually edited AHI on HSAT (Nox-T3home). (B) Identity plot comparing automatically scored AHI to manually edited AHI on HSAT (Nox-T3home). (C) Bland Altman plot comparing automatically scored AHI to in-laboratory portable monitor recording (Nox-T3lab). (D) Identity plot comparing automatically scored AHI to in-laboratory portable monitor recording (Nox-T3lab). Scoring of hypopneas in all recordings required a ≥ 4% oxygen desaturation event. AHI = apnea-hypopnea index, CI = confidence interval, HSAT = home sleep apnea testing, Nox-T3home = home sleep apnea testing using the Nox-T3 device, Nox-T3lab = in-laboratory portable monitor recording using the Nox-T3 device.

