Fig. 3.

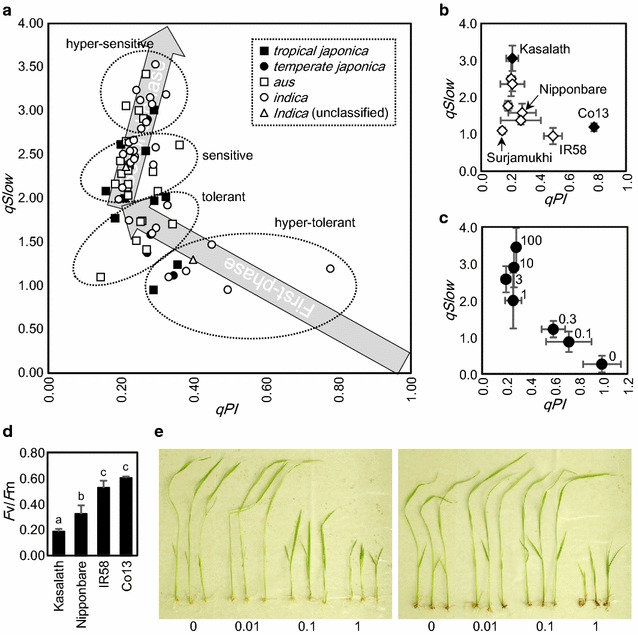
Estimation of oxidative stress tolerance of World Rice Core Collection. a qPI and qSlow values of 67 cultivars. Data represent means of four replications. b The same data as a, of selected cultivars. White diamonds indicate all seven modern cultivars analyzed in this experiment. Data represent means and standard deviations. c qPI and qSlow values of Nipponbare treated with a series of concentrations of methyl viologen. Concentrations of methyl viologen are shown to the right of each plot. Data represent means and standard deviations. n = 4. d Fv/Fm values of four cultivars, after treatment with methyl viologen. Data represent means and standard deviations. n = 4. Different alphabets up to bars indicate statistical difference by Student’s t test (P < 0.05). e Koshihikari (left) and Co13 (right) seedlings grown in media containing methyl viologen. Concentrations of methyl viologen in media are indicated under photographs (μM)
