
Fig. 4.
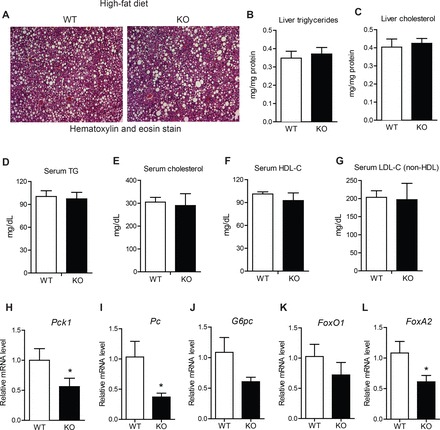
Lipid profiles and reduced hepatic gluconeogenic gene expression in HFD-fed Ctrp7-KO mice. A: representative liver histology (H&E stain; ×100 magnification) of high-fat diet (HFD)-fed wild-type (WT) and knockout (KO) male mice. Liver triglyceride (B) and cholesterol (C) level measurements of HFD-fed WT (n = 10) and KO (n = 11) male mice. Serum triglyceride (D), cholesterol (E), high-density lipoprotein (HDL) cholesterol (F), and low-density lipoprotein (LDL) cholesterol (G) level measurements of HFD-fed WT (n = 5) and KO (n = 8) male mice. H–L: quantitative real-time PCR analysis of expression of gluconeogenic genes (Pck1, Pc, G6Pc, FoxO1, FoxA2) in the liver of WT (n = 11) and KO (n = 11) male mice. Real-time PCR data were normalized to 36B4. *P < 0.05 (Mann-Whitney U-test). Pck1, phosphoenolpyruvate carboxykinase; Pc, pyruvate carboxylase; G6Pc, glucose-6-phosphatase; FoxO1, Forkhead box protein O1; FoxA2, Forkhead box protein A2.