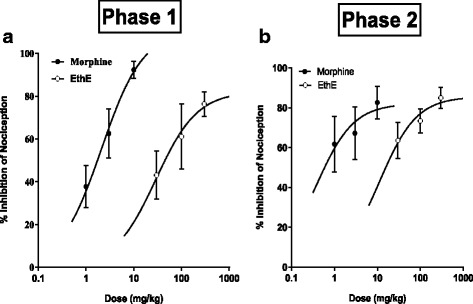
Fig. 4.

Dose response curves of EthE (30-300 mg/kg, p.o.) and Morphine (1-10 mg/kg, i.p.) in a Phase 1 and b phase 2 of formalin-induced nociception in mice

Dose response curves of EthE (30-300 mg/kg, p.o.) and Morphine (1-10 mg/kg, i.p.) in a Phase 1 and b phase 2 of formalin-induced nociception in mice