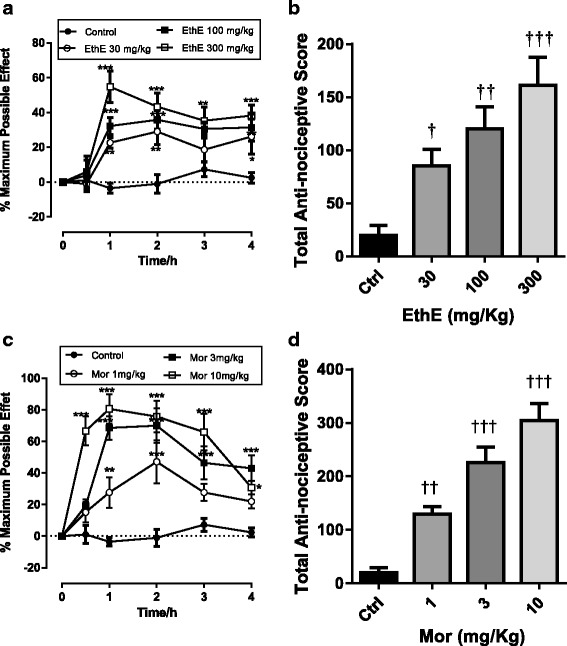
Fig. 5.

Effect of EthE (30 – 300 mg/kg, p.o.) and morphine (1 – 10 mg/kg, i.p.) on the time-course curves (a and c) and the total nociceptive score (calculated as AUCs) (b and d) of tail-immersion test in rats. Each data represents the mean of 5 animals and the error bars indicate S.E.M. The symbols * and † indicate significance levels compared to respective controls: ***P < 0.001, **P < 0.01 and *P < 0.05 (two – way ANOVA followed by Bonferroni’s post hoc). †††P < 0.001, ††P < 0.01 and †P < 0.05 (one-way ANOVA followed by Newman-Keuls’ post hoc)
