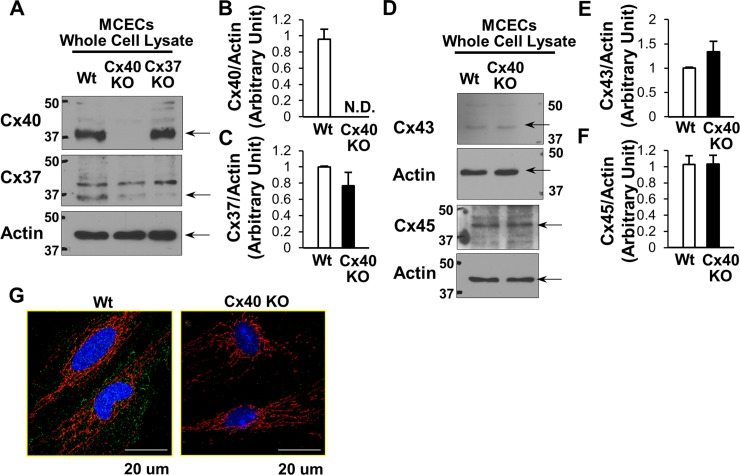
Fig. 2.
Protein levels of Cx40, Cx37, Cx43, and Cx45 in MCECs. A and D: typical WB images of Cx40, Cx37, Cx43, and Cx45 protein levels in the whole lysate of MCECs isolated from WT, Cx40 KO, and Cx37 KO mice. Actin was used as a loading control for samples of whole lysate from MCECs. B: Cx40 protein level normalized to actin: WT (n = 5) and Cx40 KO (n = 5). Data are means ± SE. C: Cx37 protein levels in MCECs of WT and Cx40 KO mice (n = 4 in each group). Data are means ± SE. E: Cx43 protein levels in MCECs of WT and Cx40 KO mice (n = 5 in each group). Data are means ± SE. F: Cx45 protein levels in MCECs of WT and Cx40 KO mice (n = 6 in each group). Data are means ± SE. G: photomicrographs show typical image of Cx40 expression in WT MCECs (left) and Cx40 KO MCECs (right). MCECs were stained with Cx40 (green) and Tom20 (a marker of mitochondria; red).

