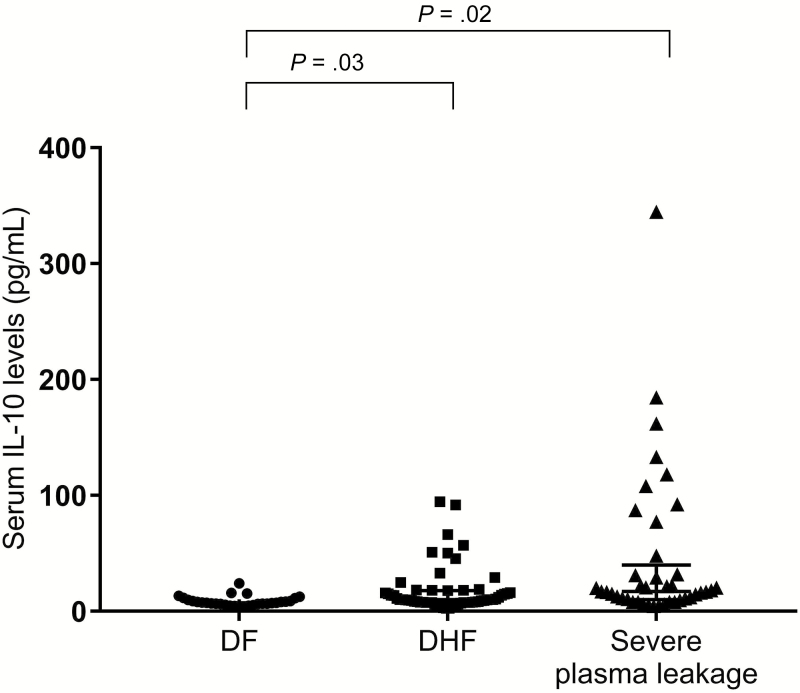
Figure 1.
Scatter plot of the serum interleuking 10 (IL-10) levels in the dengue fever (DF), dengue hemorrhagic fever (DHF), and severe plasma leakage groups. The horizontal bars represent the median serum IL-10 levels. Differences in the median between pairs of groups were tested using the Mann–Whitney test (P = .03 for the difference between the DF and the DHF groups; P = .02 for the difference between the DF and the severe plasma leakage groups).

