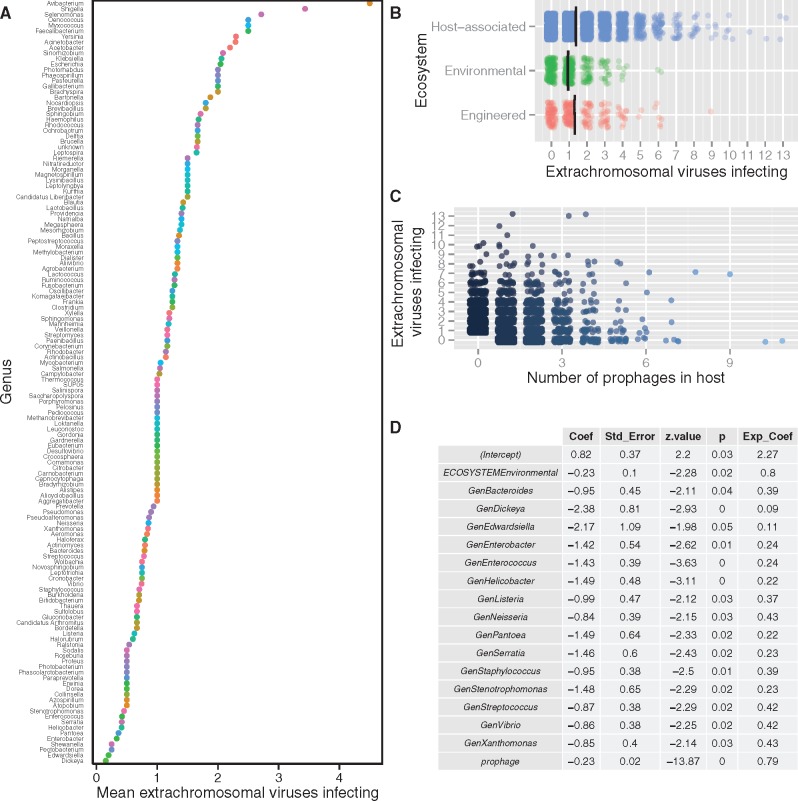
Figure 2.
Host taxonomy, ecology, and number of prophage sequences predict variation in culture coinfection. The data set is composed of viral infections detected using sequence data (n = 12,498) in all bacterial and archaeal hosts (n = 5,492) with sequenced genomes in the National Center for Biotechnology Information’s (NCBI) databases, supplemented with data on host habitat and energy source collected primarily from the Joint Genome Institute’s Genomes Online Database (JGI-GOLD). Extrachromosomal viruses represent ongoing acute or persistent infections in the microbial culture that was sequenced. Thus, increases in the axes labeled ‘…extrachromosomal viruses infecting’ represent increasing viral coinfection in the host culture (not necessarily in single cells within that culture). The number of extrachromosomal viruses infecting a host was the response variable in a negative binomial regression that tested the effect of five variables (the number of prophage sequences, ssDNA virus presence, host taxon, host energy source, and habitat ecosystem) on variation in the response variable. Plots A–C depict all variables retained after stepwise model selection using Akaike’s Information Criterion (AIC). In Panel A, each point represents a microbial genus with its corresponding mean number of extrachromosomal virus infections (only genera with >1 host sampled and nonzero means are included). The colors of each point correspond to each genus. In Panels B and C, each point represents a unique host with a corresponding number of extrachromosomal virus infections. Panel B groups hosts according to their habitat ecosystem, as defined by JGI-GOLD database schema; the point colors correspond to each of these three ecosystem categories. Panel C groups hosts according to the number of prophage sequences detected in host sequences; the color shades of points become lighter in hosts with more detected prophages. Panels B and C have data points are offset by a random and small amount (jittered) to enhance visibility and reduce overplotting. The regression table is presented in Panel D, and only includes variables with P < 0.05.

