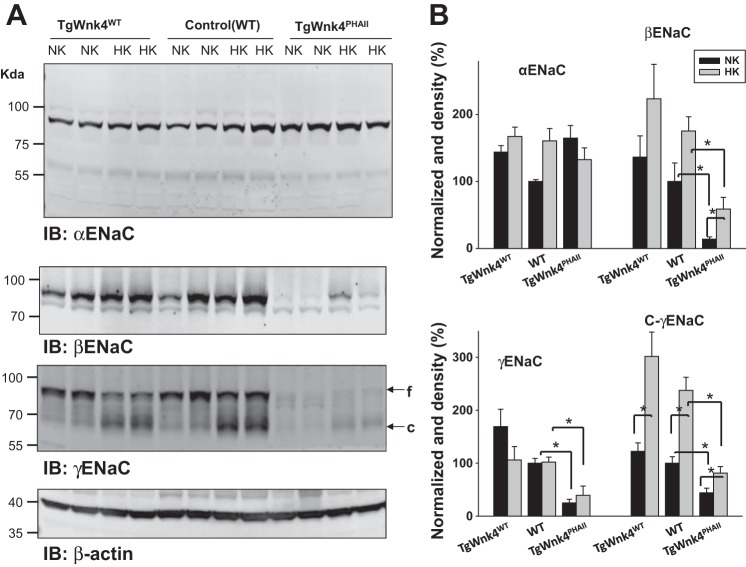
Fig. 3.
Expression of α-, β-, and γENaC in WT, TgWnk4WT, and TgWnk4PHAII mice. A: Western blot showing the expression of α-, β-, and γENaC in TgWnk4WT, WT, and TgWnk4PHAII mice on normal-K+ (NK) diet or on a high-K+ (HK) diet, respectively. Arrows indicate the full-length (f) γENaC and cleaved (c) γENaC subunit, respectively. B: bar graph shows the normalized band density of α-, β-, γ- and cleaved γENaC (C-γENaC) subunits. *Significant difference.

