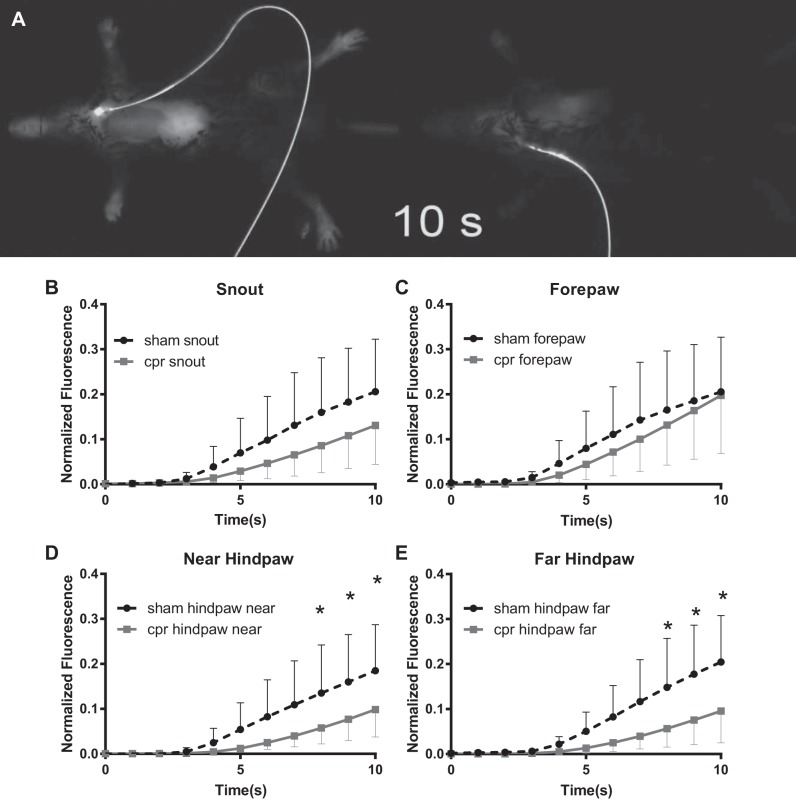
Fig. 6.
Transcutaneous fluorescence bolus distribution time measurements. A: still from 1 Hz recording of 800-nm fluorescence starting at bolus injection (see Supplemental Video S4). At 10 s after injection, sham (left) demonstrates widespread fluorescence, indicating extensive distribution of ZW800-1. Cardiac arrest and cardiopulmonary resuscitation-treated mouse (right) demonstrates reduced rate of distribution, the snout and chest have just begun to exhibit fluorescence. B–E: plots of time-density relationship for ZW800-1 fluorescence at 1 Hz imaging frequency for 10 s after bolus injection. The distal hind extremity regions of interest demonstrated significant differences in fluorescence starting 8 s after injection.

