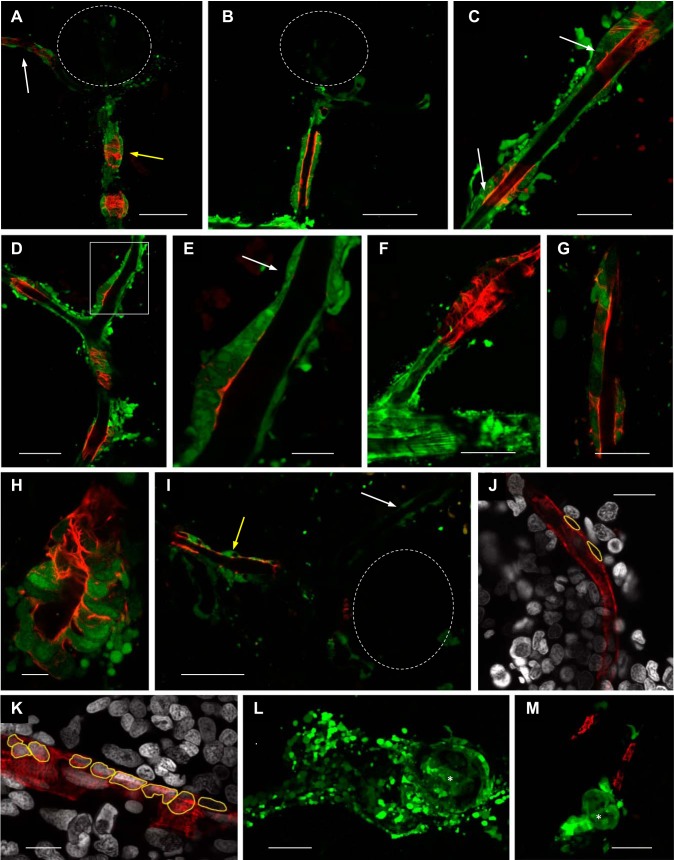
Fig. 2.
Expression of smooth muscle and pericyte markers in mesonephric renin cells. To determine the relationship of renin-expressing cells with smooth muscle cells and pericytes, ren:LifeAct-RFP fish were crossed to transgenic lines for established mural cell markers. In mammals and fish, pdgfrb is an early marker of pericytes and smooth muscle actin (acta2) is a marker of mature pericytes and smooth muscle cells. Expression of perivascular cell markers was assessed in JG, preglomerular, and efferent ren:LifeAct-RFP-expressing cells. A: maximum-intensity projection of Tg(ren:LifeAct-RFP, acta2:EGFP) shows coexpression of acta2-EGFP and ren:LifeAct-RFP in the juxtaglomerular (JG) afferent and efferent cells (glomerulus, white outline; efferent arteriole, white arrow; afferent arteriole, yellow arrow). Scale bar = 50 µm. B–E: single 0.5-µm optical sections of Tg(ren:LifeAct-RFP, acta2:EGFP). B: JG renin cell clusters strongly express acta2. Filamentous actin is highest in density at the luminal region of renin-expressing cells. Scale bar = 50 µm. C: both acta2-EGFP and ren:LifeAct-RFP are also coexpressed in preglomerular arteriolar renin clusters (white arrows) in Tg(ren:LifeAct-RFP, acta2:EGFP). Scale bar = 25 µm. D: clusters of ren:LifeAct-RFP express acta2-EGFP at a preglomerular branch point in Tg(ren:LifeAct-RFP, acta2:EGFP). Scale bar = 25 µm. E: detail of preglomerular arteriolar cells from D showing renin cells have a cuboidal shape in contrast to neighboring and thinner-bodied smooth muscle cells (white arrow). Scale bar = 10 µm. F: expression of acta2:EGFP is always present but variable as shown by the projection of weaker expression in some preglomerular renin cell clusters. Scale bar = 25 µm. G and H: 0.5-µm optical sections of Tg(ren:LifeAct-RFP, pdgfrb:EGFP) showing detail of pdgfrb-EGFP expression both at a preglomerular artery (G) and in JG cells (H). Scale bars = 10 µm. I: a single 0.5-µm optical section of Tg(ren:LifeAct-RFP, pdgfrb:EGFP) showing coexpression of ren:LifeAct-RFP and pdgfrb-EGFP in the afferent JG cells (yellow arrow). The efferent arteriole (white arrow) also expresses pdgfrb-EGFP; glomerulus, white outline. Scale bar = 25 µm. J and K: Confocal projections of nuclei stained with DAPI (gray) inside ren:LifeAct-RFP-expressing cells (yellow outlines). In renin cells of the efferent arterioles, nuclei are flattened occupying a thin-bodied cell (J). Epithelioid renin cells are present as multicellular clusters (K). Nuclei not outlined within ren:LifeAct-RFP regions are endothelial. Scale bars = 10 µm. L and M: Tg(ren:LifeAct-RFP, wt1b:GFP) showing early-stage (L) and late-stage (M) nascent nephron clusters expressing Wilm's tumor (wt1b:GFP). Expression of ren:LifeAct-RFP is only detected in the latter stages of nephron development and is associated with the juxtaglomerular cells of the afferent arteriole. *Glomeruli. Scale bars = 25 µm.

