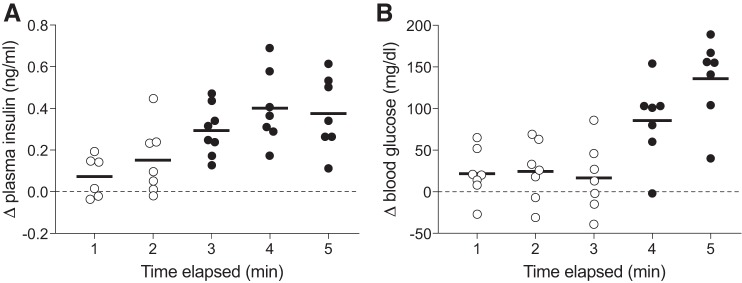
Fig. 1.
Plasma insulin (A) concentration increased more rapidly than did plasma glucose (B) concentration after mice initiated licking for 1.0 M glucose (experiment 1). Each mouse took a weight-specific number of licks (4.3/g mouse). We represent scores from individual mice as a circle, and the mean score as a horizontal line. We use closed circles to indicate the time points when the mean change in plasma insulin (or blood glucose) was significantly greater than zero (P < 0.004; one-sample t-test), and open circles to indicate the time points when it was not significantly greater than zero (P > 0.05).

