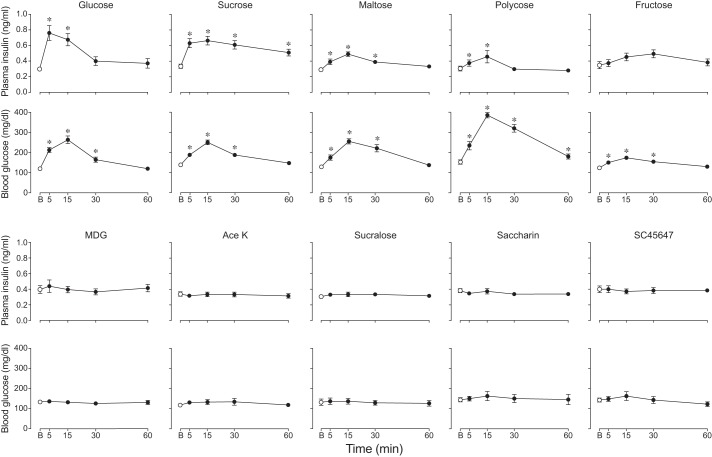
Fig. 4.
Some taste stimuli caused larger changes in plasma insulin and blood glucose dynamics than did others (experiment 3). Each B6 mouse took a mass-specific number of licks (4.3 licks/g mouse) for the isoacceptable concentration of each taste stimulus. In each panel, we indicate baseline (B) measurements with an open circle, and subsequent changes in plasma insulin or blood glucose with closed circles (means ± SE). *Time points at which the plasma insulin or blood glucose concentrations were significantly greater than baseline (P < 0.05, Dunnett’s multiple comparisons test). See Table 1 for further analysis of these results. The taste stimulus abbreviations and number of mice tested were as follows: glucose (Gluc; n = 9), sucrose (Sucro; n = 6), maltose (Malt; n = 8), Polycose (Poly; n = 8), fructose (Fruc; n = 6), MDG (n = 7), saccharin (Sacc; n = 8) Ace K (n = 8), sucralose (Sucra; n = 8), and SC45647 (SC; n = 8).

