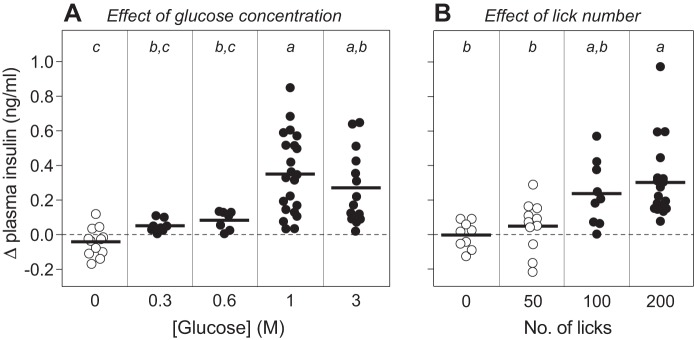
Fig. 7.
CPIR magnitude increased with glucose concentration (A) (i.e., sweetness intensity) and number of licks (B) (i.e., duration of stimulation) (experiment 5). We defined CPIR as a significant increase in plasma insulin concentration, relative to baseline, within 5 min of initiating licking for the taste stimulus (i.e., Δ plasma insulin concentration), based on a one-sample t-test (P < 0.05). For each treatment level, we represent the scores from each mouse as a circle, and the mean score as a horizontal line. We distinguish treatment levels that either did or did not elicit a CPIR with closed and open circles, respectively. We varied stimulation intensity by allowing B6 mice to take a weight-specific number of licks (4.3 licks/g mouse) for different concentrations of glucose. We varied stimulus duration by allowing mice to take different numbers of licks for 1 M glucose. We compared the mean CPIR values within A or B, using Tukey’s multiple comparison test. Means that differ significantly from one another lack a shared letter (i.e., a, b, or c) above them (P < 0.05).

