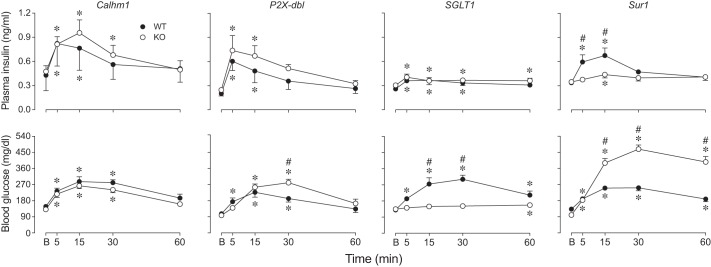
Fig. 9.
Knocking out Calhm1, the P2X2+P2X3 receptor, SGLT1, or Sur1 differentially impacted plasma insulin and blood glucose dynamics (experiment 6). All B6 mice took a mass-specific number of licks (4.3 licks/g mouse) for 2.8 M glucose. We show changes in plasma insulin (top row) and blood glucose (bottom row) concentrations (means ± SE), relative to baseline (B). In each panel, we compare responses of WT and KO mice. In instances where the time × genotype interaction was significant within in a panel (based on results in Table 3), we compared genotypes at each time period with Sidak’s multiple comparison test (#P < 0.05). We also compared the plasma insulin or blood glucose concentration at baseline (B) with that at each successive time-point, separately for each treatment group, using Dunnett’s multiple comparison test (*P < 0.05). We tested the following number of mice: Calhm1 WT (n = 8) and KO (n = 7); P2X-dbl WT (n = 8) and KO (n = 7); SGLT1 WT (n = 10) and KO (n = 10); and Sur1 WT (n = 12) and KO (n = 11).

