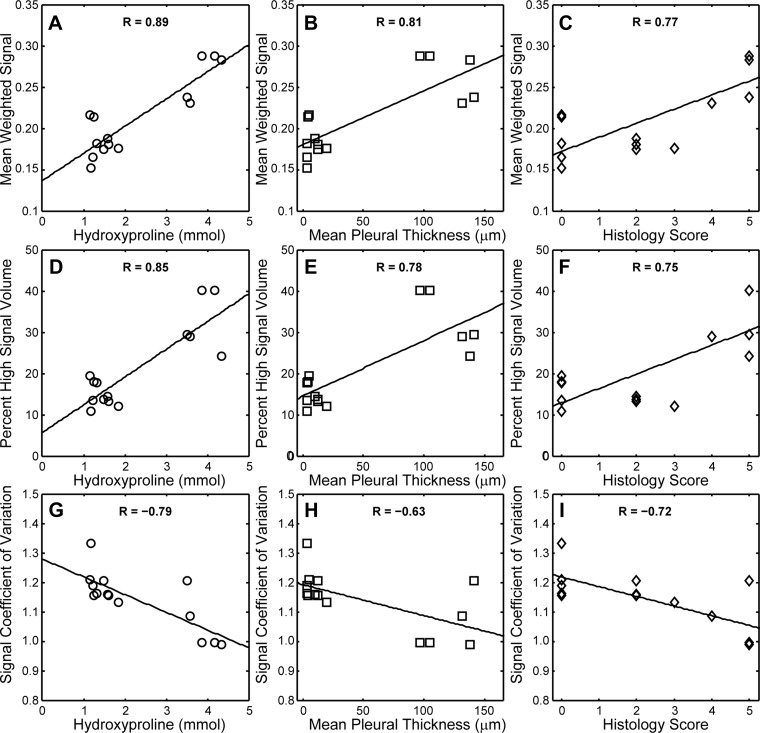
Fig. 3.
Correlations between MRI-derived and conventional metrics during fibrosis progression. Lines are least-squares fits; correlation coefficients (R values) are provided for each regression. Mean weighted signal increased with hydroxyproline content (P = 2 × 10⁻⁵), mean pleural thickness (P = 0.005) and histology score (P = 0.001) in A–C, respectively. Similarly, percent high signal intensity lung volume increased with hydroxyproline content (P < 0.001), mean pleural thickness (P < 0.001) and histology score (P = 0.002) in D, E, and F, respectively. The signal coefficient of variation (a measure of image heterogeneity) decreased with hydroxyproline content (P < 0.001), mean pleural thickness (P = 0.016) and histology score (P = 0.004) in G, H, and I, respectively.

