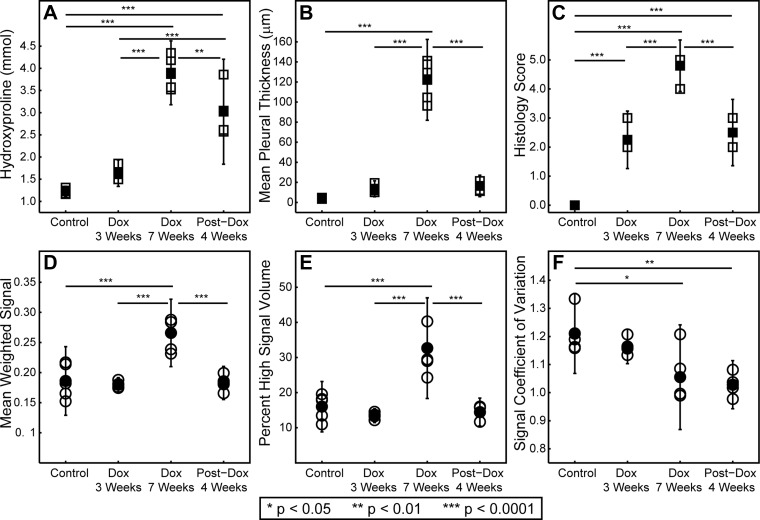
Fig. 4.
Cross-sectional comparison of experimental cohorts. Traditional fibrosis metrics, hydroxyproline content (A), mean pleural thickness (B), and histology score (C), are represented by square symbols. MRI-derived metrics, mean weighted signal (D), percent high signal volume (E), and coefficient of variation (F), are represented by circles. Open symbols are values obtained from individual mice, and closed symbols are cohort means. Vertical bars are 95% confidence intervals around the means. Significant differences are denoted with horizontal lines, and the level of significance is denoted by asterisks (see legend).

