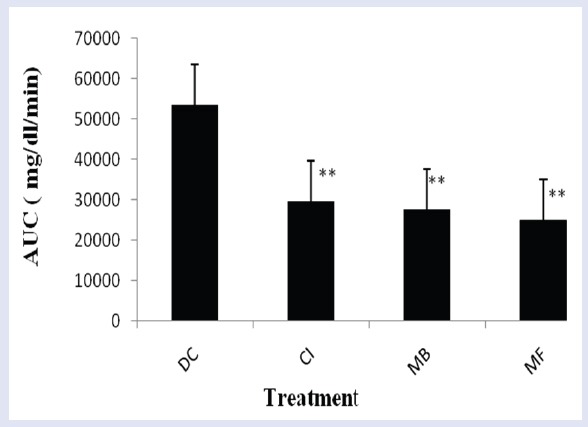
Figure 2.

Representation of area under the curve (AUC) of blood glucose levels after OGTT in STZ-NA-induced mild diabetic rats.
DC: Diabetic control (1 mL/kg BW of 0.3% CMC in distilled water, p.o.); CI: pretreated with chloroform extract of Coccinia indica fruits (250 mg/kg BW) for seven days; MB: pretreated with chloroform extract of Momordica balsamina fruits (250 mg/kg BW) for seven days; MF: pretreated with metformin (15 mg/kg BW, p.o.) for seven days. Values are expressed as of mean ± S.D.; n = 5 in each group. **P < 0.01, significant versus DC.
