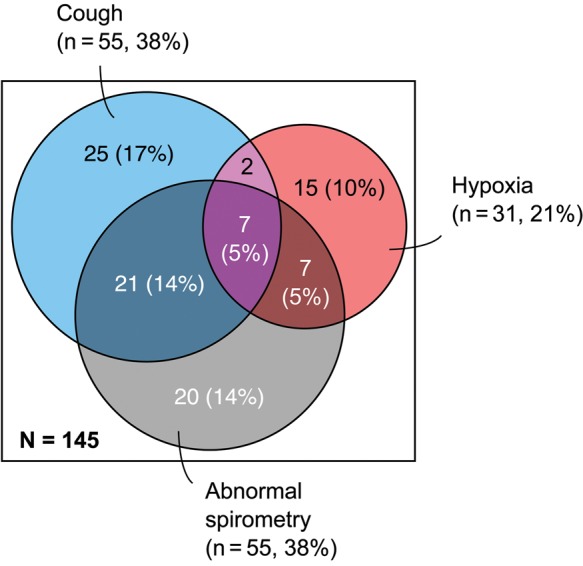
Figure 3.

Proposed CLD phenotypes. Proportional areas diagram illustrating the proposed CLD phenotypes, “cough” and “hypoxia”, and their overlap with individuals with abnormal spirometry. Percentages indicate the proportion of the entire study population for which spirometry data were available.
