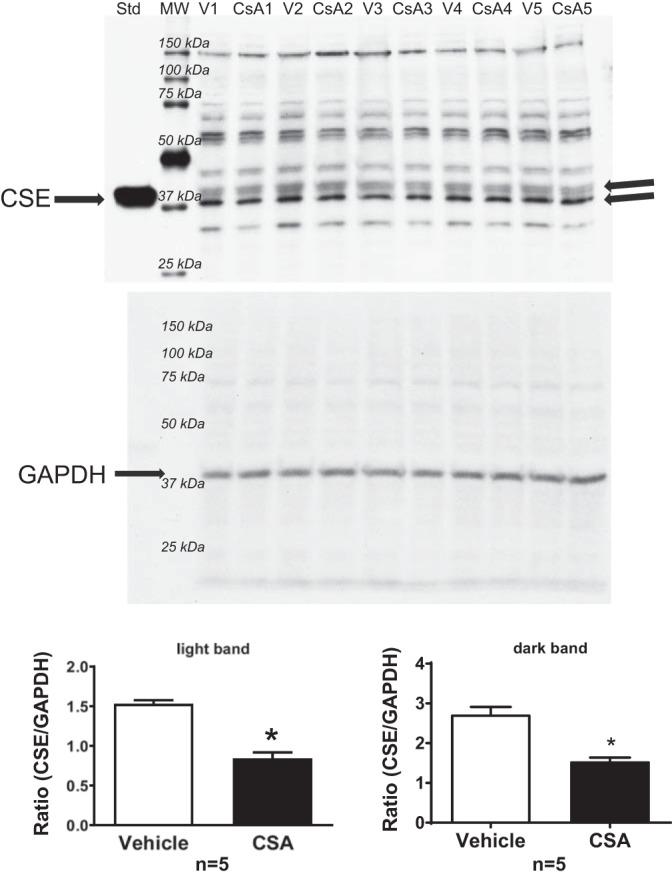
Fig. 4.

CSE protein expression in RAEC treated with vehicle or CsA (1 µM) for 90 h. A single blot was probed with either an antibody against CSE (top) or GAPDH (bottom), and then CSE expression was calculated as the ratio of CSE/GAPDH density to control for loading differences. Values are means ± SE. *P < 0.05 vs. vehicle; n = 5 batches of RAEC from passage 2 to 5.
