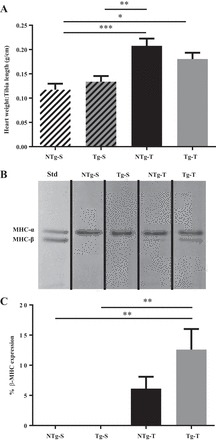
Fig. 1.

Transaortic constriction induced cardiac hypertrophy in both NTg and Tg mice. A: heart weight-to-tibia length ratio (n = 5–10 hearts/group). B: representative 6% SDS-PAGE gel image showing-myosin heavy chain isoform (α and β) expression (n = 6 hearts/group). Std is neonatal mouse heart expressing both myosin-heavy chain isoforms. Black lines demarcate region of interest spliced from the same image. C: quantification of myosin heavy chain isoform expression in NTg-S, Tg-S, NTg-T, and Tg-T whole homogenate mouse hearts. Data are represented as means ± SE. Statistically significant result based on Tukey’s post hoc test: *P < 0.05, **P < 0.01, ***P < 0.001.
