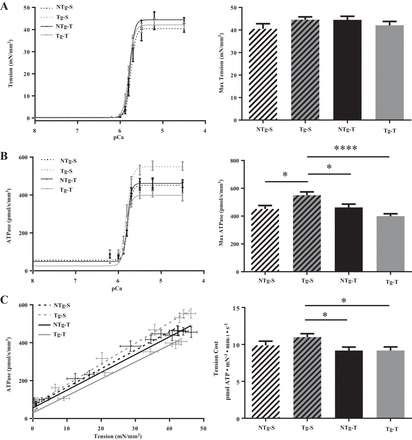
Fig. 3.

pCa-tension and pCa-ATPase relation in mouse cardiac skinned fiber bundles isolated from NTg-S, NTg-T, Tg-S, and Tg-T mice. A: tension-pCa relationship. B: ATPase-pCa relationship. C: tension cost. Data are presented as means ± SE; n = 8–15 fibers from 5 to 6 hearts per group. Tension cost is estimated as the slope of the linear relationship between tension (A) and ATPase activity (B). Data on right are represented as means ± SE. Statistically significant result based on Tukey’s post hoc test: *P < 0.05; ****P < 0.0001.
