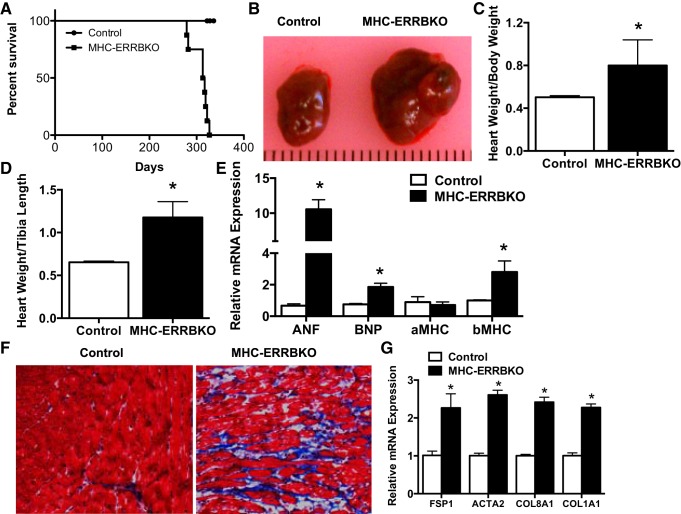
Fig. 2.
Cardiac phenotype of MHC-ERRB KO mice. A: Kaplan-Meier survival curve of MHC-ERRBKO animals. B: gross heart anatomy of the MHC-ERRBKO animals compared with control animals. C: heart weight normalized to body weight (HW/BW). D: heart weight normalized to tibial length (HW/TL). E: mRNA expression of heart failure markers. F: Masson trichrome staining. G: qPCR expression of markers of fibrosis of MHC-ERRBKO and control animals at 9–10 mo of age. Data are presented as means ± SE; n = 4–6 per group; *P < 0.05 compared with control animals.

