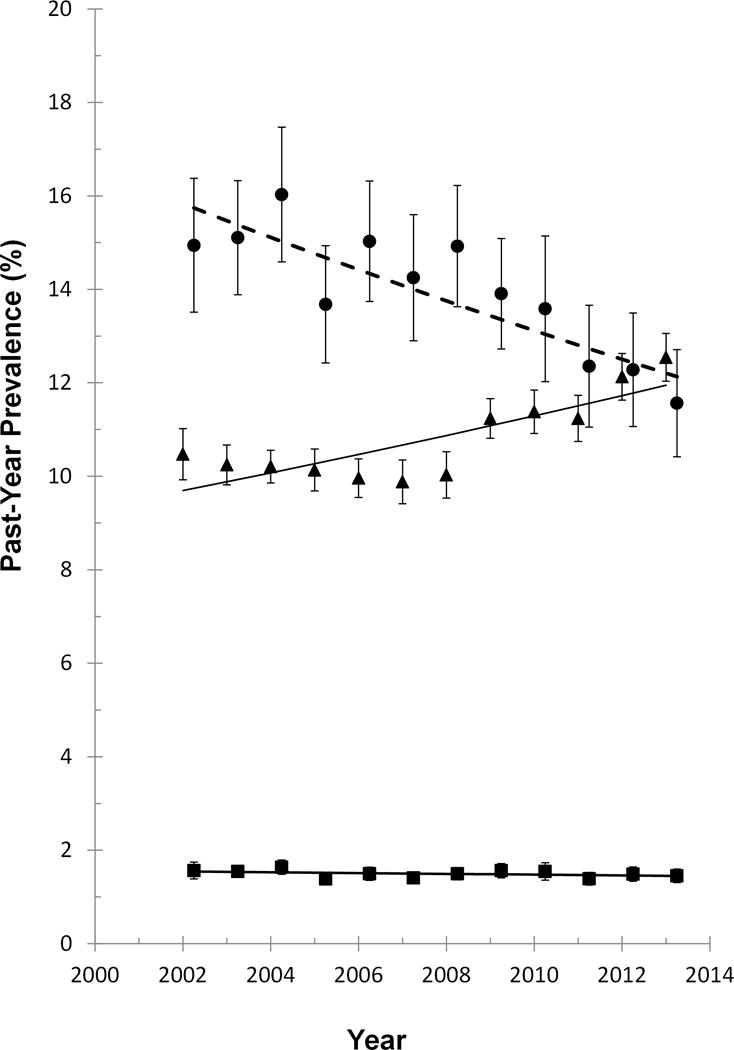
Figure.

Past-year prevalence estimates for marijuana use (triangles), marijuana use disorder (squares) and marijuana use disorder among past-year users (circles), 2002–2013. Lines represent fits to linear trend models and are not meant to describe the precise functional form of the trends. Error bars represent 95% confidence intervals. Trends were analyzed using the “surveylogistic” procedure in SAS version 9.4, modeling each outcome variable as a function of year of assessment.
