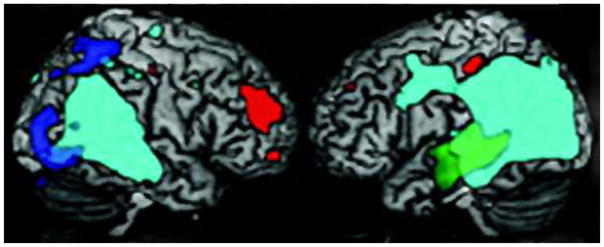
Figure 2. Voxel-based morphometry of parietal overlap of EOAD phenotypes78.
Light green represents overlap of all EOAD variants. Green=Type 2 AD-lvPPA; Blue=Type 2 AD-PCA; Red= Other EOAD.
Source of neuroimage: Migliaccio R, Agosta F, Rascovsky K, et al. Clinical syndromes associated with posterior atrophy: early age at onset AD spectrum. Neurology. 2009;73(19):1571–1578.

