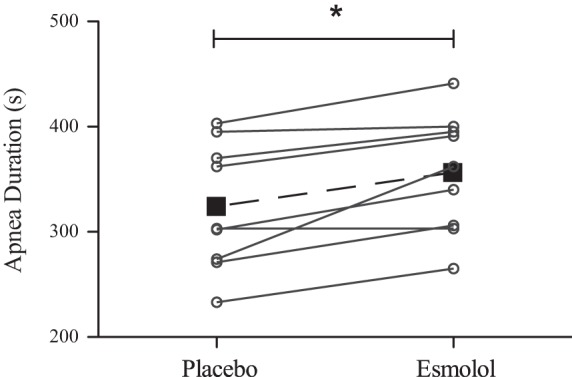
Fig. 1.

Maximal apnea duration during placebo and esmolol trials. Individual data are represented by ○ and solid lines, whereas mean data are represented by ■ and the dashed line. Overall, there was a 32 ± 25-s increase in apnea duration with esmolol treatment. *Significant difference in apnea duration (P < 0.01).
