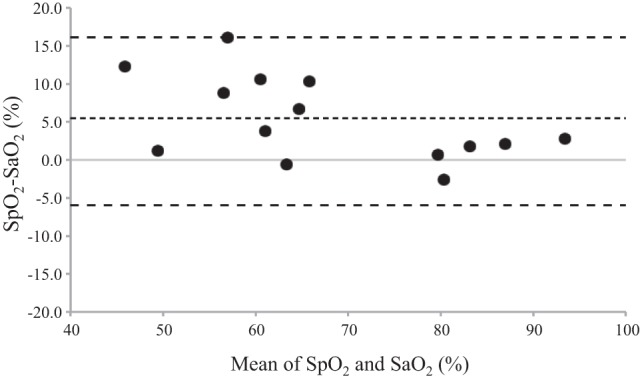
Fig. 4.

A Bland-Altman plot of and at the end of a maximal apnea. This figure demonstrates an overestimation of (radial blood draw) by (finger pulse-oximetry) at the end of apnea in elite breath-hold divers using data from our previous study (4). Dotted line represents the mean difference (5.3), whereas the dashed lines represent the upper and lower limits of agreement (16.1 and −5.6, respectively). Of note is that the overestimation of by is most evident below a of 70%. Each data point represents an individual subject; n = 14.
