
Fig. 3.
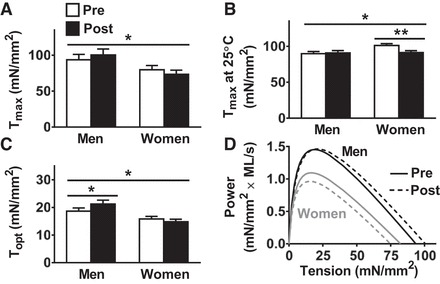
Training-induced adaptations in single MHC I fiber maximal Ca2+-activated tension (Tmax; A and B), tension at maximum power production (Topt, C), and power-tension relationships (D). All measurements were conducted at 15°C, except for Tmax at 25°C (B). Tension = force/CSA. Data represent means ± SE. *P ≤ 0.05, **P < 0.01 for training × sex effect (bar across all groups/time points) or post hoc comparison for training effect within each sex (bar across each sex separately).