We introduce, in the isolated rat lung, a new model of pulmonary edema with elevated surface tension. We first generate hydrostatic edema and then ventilate gently to increase surface tension. We investigate the mechanical mechanisms through which 1) ventilation injures edematous lungs and 2) ventilation with accelerated deflation might lessen ventilation injury.
Keywords: cardiogenic pulmonary edema, acute respiratory distress syndrome, ventilation injury, surface tension, alveolar mechanics
Abstract
Edematous lungs contain regions with heterogeneous alveolar flooding. Liquid is trapped in flooded alveoli by a pressure barrier—higher liquid pressure at the border than in the center of flooded alveoli—that is proportional to surface tension, T. Stress is concentrated between aerated and flooded alveoli, to a degree proportional to T. Mechanical ventilation, by cyclically increasing T, injuriously exacerbates stress concentrations. Overcoming the pressure barrier to redistribute liquid more homogeneously between alveoli should reduce stress concentration prevalence and ventilation injury. In isolated rat lungs, we test whether accelerated deflation can overcome the pressure barrier and catapult liquid out of flooded alveoli. We generate a local edema model with normal T by microinfusing liquid into surface alveoli. We generate a global edema model with high T by establishing hydrostatic edema, which does not alter T, and then gently ventilating the edematous lungs, which increases T at 15 cmH2O transpulmonary pressure by 52%. Thus ventilation of globally edematous lungs increases T, which should increase stress concentrations and, with positive feedback, cause escalating ventilation injury. In the local model, when the pressure barrier is moderate, accelerated deflation causes liquid to escape from flooded alveoli and redistribute more equitably. Flooding heterogeneity tends to decrease. In the global model, accelerated deflation causes liquid escape, but—because of elevated T—the liquid jumps to nearby, aerated alveoli. Flooding heterogeneity is unaltered. In pulmonary edema with normal T, early ventilation with accelerated deflation might reduce the positive feedback mechanism through which ventilation injury increases over time.
NEW & NOTEWORTHY We introduce, in the isolated rat lung, a new model of pulmonary edema with elevated surface tension. We first generate hydrostatic edema and then ventilate gently to increase surface tension. We investigate the mechanical mechanisms through which 1) ventilation injures edematous lungs and 2) ventilation with accelerated deflation might lessen ventilation injury.
in pulmonary edema that progresses beyond the interstitium to cause alveolar flooding, there are regions of the lungs in which the alveolar flooding pattern is heterogeneous (2, 20). Such regions may be located in the dependent lung, with moderate edema, or in the nondependent lung, with severe edema.
In a local edema model, in which we micropuncture a surface alveolus and infuse liquid to flood a group of alveoli, we have shown that regions with heterogeneous flooding are likely sites of ventilation injury (24). In particular, the interface of the liquid phase in flooded alveoli forms a concave meniscus (2, 10, 16) (Fig. 1). According to the Laplace relation, and as detailed previously (24), there is a pressure drop across the meniscus; alveolar air pressure, PALV, above the meniscus is greater than flooded alveolar liquid pressure, PLIQ, below the meniscus, to a degree that is proportional to surface tension, T. Thus PALV in an adjacent aerated alveolus, which equals PALV in the flooded alveolus, is also greater than PLIQ in the flooded alveolus. Across the septum between the adjacent alveoli, there is a pressure difference ΔPS, equal to PALV − PLIQ and thus proportional to T, that bows the septum into the flooded alveolus, overexpands the aerated alveolus, and concentrates stress at the border between the flooded and aerated alveoli. Lung inflation during mechanical ventilation increases T, increases ΔPS, and increases the stress concentration between adjacent aerated and flooded alveoli. Consequently, mechanical ventilation causes a sustained increase in permeability of the alveolar-capillary barrier in local regions with heterogeneous alveolar flooding (24).
Fig. 1.

Schematic of adjacent flooded and aerated alveoli. Alveolar wall is black, alveolar liquid is gray, and alveolar air is white. Alveolar air pressure, PALV, is the same in both alveoli. In flooded alveolus, there is a meniscus below which liquid pressure, PLIQ, is less than PALV. Across septum between alveoli, there is pressure difference ΔPS, which equals PALV−PLIQ and bows septum into aerated alveolus. Stress is concentrated in the overdistended, bowed septum. At border between alveoli, air-liquid interface is saddle shaped and liquid phase pressure is PLIQ⋅BORD, which is greater than PALV. Thus between liquid at border and in center of flooded alveolus, there is pressure barrier ΔPB, which equals PLIQ⋅BORD − PLIQ and traps liquid in flooded alveolus. Further details are in the text and in Kharge et al. (11).
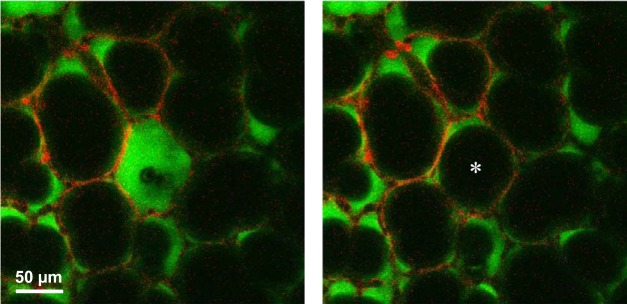
If ventilation-induced exacerbation of stress concentrations in regions with heterogeneous alveolar flooding leads to ventilation injury, then redistributing liquid more homogeneously between alveoli should reduce stress concentration prevalence and reduce ventilation injury. In the local edema model in isolated rat lungs (10, 11, 16), we have observed that flooded alveoli are generally stable (11). However occasionally, especially in the presence of just a few flooded alveoli, we observe spontaneous reaeration of a flooded alveolus (Fig. 2). The initially flooded alveolus, which is shrunken but not collapsed, appears instantaneously to pop open. The liquid that was originally trapped in the alveolus presumably redistributes among neighboring alveoli. We aim to promote more homogeneous liquid redistribution by destabilizing flooded alveoli. To do so, it is necessary to understand why liquid is trapped in discrete, flooded alveoli.
Fig. 2.
Instantaneous alveolar reaeration. Surface alveoli of isolated rat lungs are at 5 cmH2O transpulmonary pressure with calcein red-orange AM loaded into epithelium and non-cell membrane-permeable 2',7'-bis-(2-carboxyethyl)-5-(and-6)-carboxyfluorescein (BCECF)-labeled Ringer’s solution injected into air space. Air is black. Images are sequential slices of confocal z-stack, 3 μm apart. Left: central alveolus is flooded and shrunken although not collapsed. Right: captured ~5 s later, the same alveolus (*) has spontaneously become reaerated.
If the liquid phase is continuous between alveoli (3), then as we have detailed previously (11), interfacial curvature must change from concave at the meniscus in the center of a flooded alveolus to saddle-shaped at the border of the alveolus (Fig. 1); at the border, the end of a septum separating the flooded alveolus from an adjacent alveolus terminates with saddle-shaped geometry at an alveolar sac or duct (18, 23). Because of this change in interfacial curvature, liquid pressure PLIQ⋅BORD at the border of a flooded alveolus is greater than PALV (11). As PLIQ⋅BORD > PALV > PLIQ, liquid phase pressure is greater at the border than in the center of the flooded alveolus. That is, there is a pressure barrier ΔPB = PLIQ⋅BORD − PLIQ that traps liquid in flooded alveoli. Our previous analysis further detailed that ΔPB is proportional to T. That analysis is supported by our finding that lowering T promotes liquid escape from discretely flooded alveoli (11).
In the present study, we hypothesize that, by accelerating deflation during mechanical ventilation, we may, with enhanced momentum transfer during deflation (appendix), enable liquid in flooded alveoli to overcome the pressure barrier and redistribute more homogeneously among regional alveoli. We test our hypothesis in the local edema model, in which T is normal. We find that, when peak airway pressure is moderate such that peak T is moderate and the pressure barrier at the start of deflation is moderate, accelerated deflation promotes liquid escape from flooded alveoli and tends to reduce flooding heterogeneity. We also develop a new global edema model with high T in which to test our hypothesis. In isolated lungs, we first generate global hydrostatic edema in the absence of ventilation, which does not alter T, and then ventilate gently, which causes injury that should elevate alveolar capillary barrier permeability (24) and that increases T (Fig. 9A, below). The model thus pertains to ventilation injury in cardiogenic pulmonary edema and also captures key mechanical characteristics of the acute respiratory distress syndrome (ARDS). In the global edema model, accelerated deflation promotes liquid escape from flooded alveoli but does not reduce flooding heterogeneity. We find that only with low T can escaped liquid redistribute more homogeneously.
Fig. 9.
Altered lung mechanics in global edema model. A: first of 2 steps in generating the global edema model—generation of hydrostatic edema in the isolated, perfused unventilated lung—does not alter surface tension from normal. The second step—50 ventilation cycles between airway pressures of 5 and 10 cmH2O to establish the global edema model baseline—increases surface tension. Normal surface tension values are from Kharge et al. (10). B: representative airway pressure traces from the 3rd and 50th ventilation cycles. Dashed lines indicate peak deflation rate, which is constant over time.
MATERIALS AND METHODS
In isolated rat lungs, we generate local and global edema models with normal and high T, respectively, and assess whether acceleration of deflation during mechanical ventilation can promote liquid escape from flooded alveoli.
Isolated, Perfused Rat Lung Preparation
We handle all animals in accord with a protocol approved by the Stevens Institute of Technology Institutional Animal Care and Use Committee. We anesthetize (2.5–4.0% isofluorane in 100% oxygen) male Sprague-Dawley rats (n = 32, 280–375 g; Charles River, Wilmington, MA) and prepare the isolated, perfused rat lung as detailed previously (25). We position the lungs with the costal surface ridge upward and diaphragmatic surface downward, connect pulmonary arterial and left atrial cannulas to a perfusion circuit filled with a combination of 10 ml of autologous rat blood plus 18 ml of 5% bovine serum albumin (Sigma-Aldrich, St. Louis, MO) in normal saline, and initially inflate the lungs to an airway entrance pressure, PAW, of 30 cmH2O. We then reduce PAW to a constant baseline value of 5 cmH2O and perfuse the lungs at 12 ml/min and 37°C. We set left atrial pressure to 3 cmH2O, and pulmonary arterial pressure is 10 cmH2O.
Ventilation Apparatus
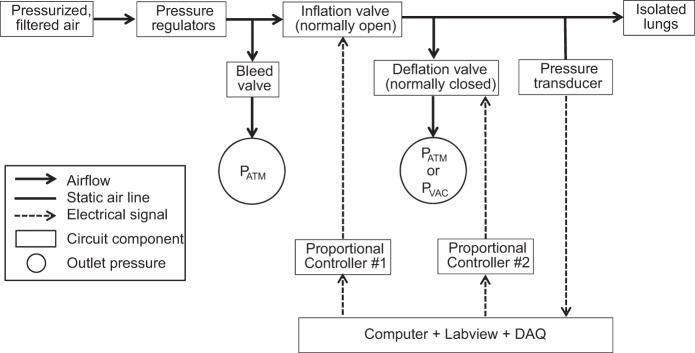
We use a custom-designed circuit (Fig. 3) to ventilate the lungs in the absence or presence of accelerated deflation. We use pressure regulators to control pressure at the inlet to the circuit, such that drift is <0.05 cmH2O/min (10). Most of the air flows out of a bleed valve on a tee branch at the start of the air flow line to the lungs. Progressing along the air flow line to the lungs are, in sequence, a normally open proportional valve (Parker-Hannifin, Fairfield, NJ) that controls lung inflation; a second tee branch leading to a normally closed proportional valve (Clippard, Cincinnati, OH) that controls lung deflation; and a blind-ended tee branch, located just proximal to the tracheal cannula, leading to a pressure transducer that records PAW. A custom Labview program sends voltages out of two channels of a data acquisition device (USB-6259; National Instruments, Austin, TX) to two proportional controllers (Canfield Connector, Youngstown, OH). The proportional controllers convert the voltages to currents and send the latter to the proportional valves. The same Labview program records PAW, acquired through the same data acquisition device.
Fig. 3.
Ventilation circuit. Filtered, regulated house air flows along tubing line to lungs. Along the tubing line are a tee branch with a manually controlled bleed valve through which most airflow exits; a computer-controlled, normally open, proportional inflation valve; a tee branch with a computer-controlled, normally closed, proportional deflation valve, distal to which pressure is atmospheric PATM or negative PVAC; and a tee branch leading to a pressure transducer used for monitoring airway entrance pressure, PAW. A custom Labview program sends control signals, via a data acquisition (DAQ) device and proportional drivers, to the 2 proportional valves; receives the transduced PAW signal via the same DAQ; and records PAW.
We ventilate the lungs between target minimum and maximum airway pressures, PAW⋅MIN and PAW⋅MAX. At the start of inflation, a maximal 5-V signal is sent to the inflation valve, and a minimal 0-V signal is sent to the deflation valve, such that both valves are closed and the lungs are held at constant inflation. During inflation, voltage to the inflation valve is decreased in an exponential fashion such that PAW rises exponentially with time. When PAW plateaus at the target PAW⋅MAX, 5 V are sent to the inflation valve to close the valve and stop inflation. At the start of deflation, a maximal 5 V are sent to the deflation valve to fully open the deflation valve. Once PAW decreases by 62% of the difference PAW⋅MAX − PAW⋅MIN, voltage to the deflation valve is reduced in a stepwise fashion until PAW plateaus at the target PAW⋅MIN. At this point, voltage to the deflation valve is returned to zero such that the valve closes. With gradual closure of the deflation valve, we avoid causing oscillations in PAW.
With this apparatus, we can optionally accelerate deflation by applying a vacuum pressure to the outlet of the deflation valve. Even with vacuum application, the targeted, positive PAW⋅MIN at the tracheal entrance is always maintained.
While ventilating the lungs, we recorded PAW with a sampling frequency of 25 Hz. From the recorded pressure traces, we quantify deflation rate at each time point during deflation as the average deflation rate over the two sampling periods bracketing the time point. From these data, we identify the peak deflation rate for each combination of ventilation settings. We note that the deflation valve is fully open at the time of peak deflation.
Imaging
We image surface alveoli that are flooded with fluorescein-labeled liquid using an upright confocal microscope (SP5; Leica Microsystems, Buffalo Grove, IL). We excite fluorescein at 488 nm and collect emitted light above 493 nm.
For T determination, we employ an ×10 air objective (0.3 N.A., 11-mm working distance, plan apochromatic) to assess alveolar response to lung inflation, as detailed below, and an ×20 water objective (0.7 N.A., 0.2-mm working distance, plan apochromatic) to image the flooded alveolar meniscus, as detailed previously (10).
To image an alveolar field, we use an O-ring support to lower a coverslip just in contact with the surface of the lungs (25). We use the O-ring and coverslip to support a saline drop into which we lower the tip of a water immersion objective. In the local edema model, we use an ×40 (0.8 N.A., 3-mm working distance, apochromatic) objective and obtain 2-μm-thick optical sections. In the global edema model, we use an ×20 (0.5 N.A., 3.5-mm working distance, apochromatic) objective and obtain 5-μm-thick optical sections. We analyze flooded alveolar fields at a subpleural depth of 20 μm.
Local Edema Model
To generate a local model of alveolar edema, we puncture an alveolus on the costal surface with a glass micropipette (oval tip opening with 4-μm minor diameter, 12-μm major diameter). Through the micropipette, we flood alveoli in a local region with ~300 nl normal saline solution (11) containing 3% albumin and labeled with 23 μM fluorescein, which does not alter T (10), for visualization. The fluid fills essentially all regional alveoli and then clears from some, leaving behind a heterogeneously flooded region (24).
Vacuum pressure determination.
In each lung, we initially test the application of vacuum pressures, PVAC, in 1-cmH2O increments and determine the threshold vacuum pressure, PVAC⋅THRESH, beyond which a further decrease in PVAC causes no further acceleration of deflation.
Experimental protocol.
Using the same relationship as we have previously (14, 24), we ventilate isolated lungs between specified PAW⋅MIN and PAW⋅MAX values to mimic ventilation in a closed-chest scenario with a given positive end-expiratory pressure (PEEP) and tidal volume, VT.
We assess the ability of accelerated deflation to redistribute liquid from flooded alveoli as follows. After generating the local edema model, we image an alveolar field in the flooded region at constant PAW of 5 cmH2O at baseline. Then we remove the O-ring and coverslip and provide the lungs with 300 ventilation cycles with a PEEP of 0, 5, or 15 cmH2O, a VT of 6 or 12 ml/kg, and a frequency of 0.33 Hz, without or with accelerated deflation. After 30, 100, 200, and 300 cycles, we pause ventilation, hold the lungs at constant PAW of 5 cmH2O, temporarily reposition the O-ring and coverslip in contact with the costal surface, and reimage the field.
Analysis of alveolar flooding distribution.
We analyze alveolar flooding distribution in a set of alveoli that are present in the confocal images from all time points, using ImageJ (National Institutes of Health, Bethesda, MD). We assess liquid escape from flooded alveoli in two ways. First, we quantify the percentage of alveoli in the analysis set that are flooded; a decrease in the percentage of flooded alveoli over time indicates reaeration of alveoli. Second, we calculate a metric for the percentage of reaerated alveoli at the final time point as (number of flooded alveoli at baseline – number of flooded alveoli at final time point)/(number of flooded alveoli at baseline). Furthermore, noting that a septum can separate two aerated alveoli, two flooded alveoli, or an aerated alveolus and a flooded alveolus, and that the last group of septa are overdistended by ΔPS (16), we quantify flooding heterogeneity as (number of septa separating aerated and flooded alveoli)/(total number of septa).
Global Edema Model
To generate an edema model with high T, we first generate hydrostatic edema and then ventilate the lungs to cause injury and increase T. We initially perfuse, but do not ventilate, the isolated lungs with a left atrial pressure of 12 cmH2O and a constant PAW of 5 cmH2O. For visualization, we include 27 μM fluorescein in the perfusate. We wait 24 ± 6 min for perfusion circuit reservoir volume to decrease by 6.3 ± 0.1 ml/kg body weight. We disconnect the perfusion circuit and open the vascular cannulae to atmospheric pressure, which does not alter lung mechanics (25). Surface alveoli at the peak of the costal surface ridge are aerated, but those partway down the side of the costal surface are flooded. We rotate the lungs to position a flooded region about halfway down the side of the costal surface below the microscope objective. We determine T in a flooded alveolus as follows. We image the alveolus at PAW of 5 and 15 cmH2O to ensure that lung inflation expands the alveolus, thus PALV equals PAW. We provide the lungs with a dynamic, two-cycle ventilation history between PAW of 5 and 15 cmH2O and then hold the lungs at PAW of 15 cmH2O. We combine servo-nulling liquid pressure measurement and confocal microscopy to determine T at PAW of 15 cmH2O according to the Laplace relation, as detailed previously (10). We find T to be normal. We reposition the lungs with the costal surface ridge upward and ventilate the lungs 50 times between PAW of 5 and 10 cmH2O. We rotate the lungs, determine T in a flooded region about halfway down the side of the costal surface, and find T to be elevated. We also image a flooded, side-surface field at about the same vertical position and inject a drop of 1% Sudan Black-labeled castor oil into an alveolus to landmark the imaged field. We reposition the lungs with the costal surface ridge upward. At this point, we have established the baseline condition of the global edema model.
Vacuum pressure determination.
In preliminary experiments, in healthy aerated lungs and after establishing the global edema model baseline, we determine the effect of vacuum application on peak deflation rate. We ventilate the lungs between PAW of 6.3 and 18.3 cmH2O and test vacuum pressures between 0 and −20 cmH2O, in 1-cmH2O increments. From an oleic acid lung injury model with an unknown degree of edema relative to that in our own model, we estimate that this PAW range for edematous isolated lungs corresponds to ventilation of edematous lungs in a closed-chest scenario with a PEEP of 14 cmH2O and a peak inspiratory pressure of 31 cmH2O (14). This peak inspiratory pressure level is comparable to that in low tidal volume ventilation of patients with ARDS (4). We identify the vacuum pressure that maximally accelerates deflation.
Experimental protocol.
In separate experiments from those for vacuum pressure determination, we test the ability of accelerated deflation to promote liquid escape from flooded alveoli. We establish the global edema model baseline and then ventilate the lungs 100 times between PAW of 6.3 and 18.3 cmH2O without or with application of the vacuum pressure that maximally accelerates deflation. At the end of the experiment, we rotate the lungs and reimage the same flooded, side-surface field as we imaged and landmarked at baseline. In a control group, we establish the global edema model baseline but do not ventilate the lungs.
At the end of the experiment, we tie off and separate the lower right lobe. We use the lower right lobe to determine wet-to-dry ratio, with dry weight measured after 24 h at 76°C.
With the remainder of the lungs inflated to PAW of 5 cmH2O, we fix the lung tissue and airway liquid. We tie off the trachea, submerge the lungs in normal saline solution, heat the submerged lungs in a microwave oven for 4 min to above 60°C, immerse the lungs in 4% paraformaldehyde for 48 h, and transfer the lungs to 70% ethanol (9). From the fixed left lung, we obtain a hematoxylin and eosin-stained sagittal section located approximately one-third of the way from the median plane through the transverse thickness of the lung (Histowiz, Brooklyn, NY).
Analysis.
In fluorescent images of the lung surface, using ImageJ to analyze the set of alveoli present in the images at both time points, we quantify the percentage of alveoli that are flooded.
In images of the histologic sections, we assess edema liquid distribution using the program ImageScope (Leica Biosystems, Buffalo Grove, IL). We select a region of interest around the full sagittal section but exclude major airways and vessels. We identify a threshold pixel value that distinguishes the colored pixels of tissue- and liquid-filled regions, together, from the white pixels of aerated regions. As we do not distinguish between flooding liquid and tissue, we do not quantify the percentage of flooded alveoli as in surface images. Rather, dividing the number of white pixels by the total number of pixels, we quantify the percentage of the section that is aerated.
To determine how redistribution of liquid from discretely flooded alveoli to the liquid lining layers of surrounding aerated alveoli should affect the percentage of the histologic section that is aerated, we approximate alveoli as spheres. We consider that a spherical volume of liquid with radius RF escapes from an initially flooded alveolus and redistributes across N aerated alveoli. In the aerated alveoli, the new liquid increases the thickness of the liquid lining layer by dimension t. Thus, the radius of the air-liquid interface in the aerated alveoli is decreased from initial RA to RA – t where, because aerated alveoli are larger than flooded alveoli, RA = kRF, with k > 1. The additional liquid lining layer volume , or , must equal the escaped volume . Therefore . In a two-dimensional histologic section there is equal probability of intersecting a flooded alveolus at any axial position. Thus, the average cross-sectional area in a histologic section of the liquid that will escape from a flooded alveolus is found by integrating the series of cross-sections present along the diameter of the liquid sphere, which yields sphere volume , and dividing by diameter 2RF: . Likewise, the average cross-sectional area in a histologic section of liquid added to N aerated alveoli is N times the volume of the new liquid shell in each aerated alveolus, , divided by diameter 2RA = 2kRF: . Thus, because of the larger size of the aerated alveoli, < and the cross-sectional area of liquid in a histologic section should decrease when liquid redistributes from flooded alveoli to the liquid lining layers of aerated alveoli. Furthermore, because reaeration expands alveolar size (Fig. 2), liquid redistribution should increase the cross-sectional area of air in a histologic section. Overall, the fraction of the histologic section that is aerated should increase.
Statistics
We report data as means ± SD. We make paired comparisons by Student’s t-test. We make multiple comparisons by ANOVA and post hoc Tukey’s analysis. When comparing responses to multiple independent parameters, e.g., PEEP, VT, and absence/presence of accelerated deflation, we report differences between groups for which only one independent parameter differs. We accept statistical differences at P < 0.05.
RESULTS
In the local edema model with normal T, we show that accelerated deflation, under the right conditions, causes liquid escape from flooded alveoli and tends to reduce flooding heterogeneity. This finding supports the presence of a pressure barrier that traps liquid in discrete alveoli. In the global edema model with high T, both the pressure barrier and lung recoil are elevated. With passive deflation, the increased lung recoil increases deflation rate but not sufficiently to overcome the elevated pressure barrier. Further acceleration of deflation enables the pressure barrier to be overcome and causes liquid escape from flooded alveoli but does not reduce flooding heterogeneity. High T limits the ability of accelerated deflation to reduce flooding heterogeneity, thus lessen ventilation injury.
Local Edema Model
At the start of each experiment in which local regions are to be flooded to model edema, we characterize the effect of vacuum application on peak deflation rate under the ventilation conditions that are to be tested (Fig. 4). Subsequently, to accelerate deflation, we use a PVAC that is 1 cmH2O more negative than PVAC⋅THRESH.
Fig. 4.
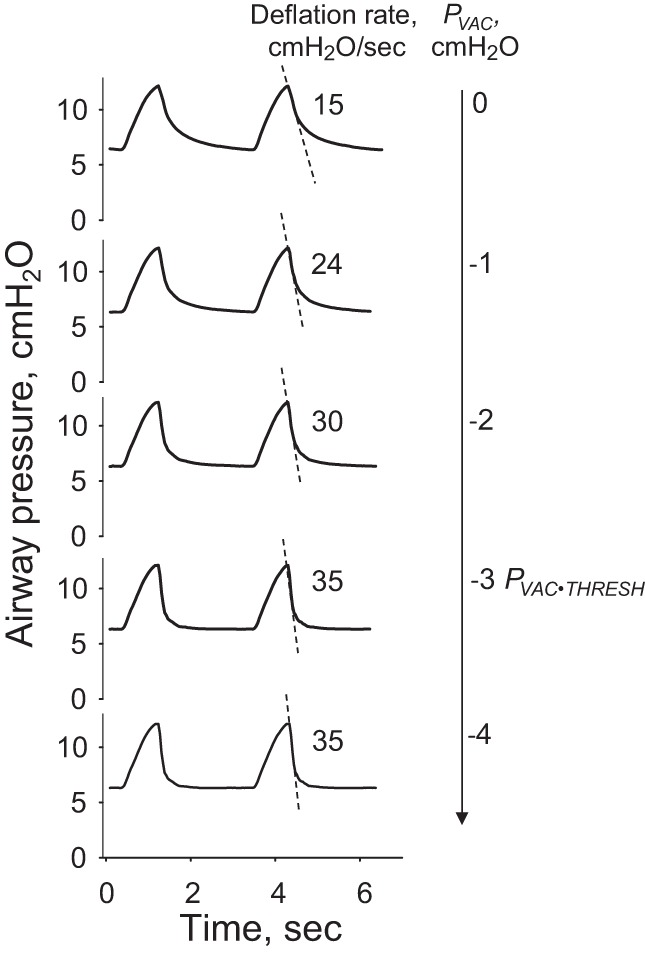
PVAC effect on peak lung deflation rate in normal lungs before establishment of the local edema model. Dashed lines depict peak deflation rates, which increase with greater vacuum application. There is a threshold vacuum pressure, PVAC⋅THRESH, beyond which increasingly negative pressures fail further to accelerate deflation. Deflation is accelerated using a pressure 1 cmH2O more negative than PVAC⋅THRESH.
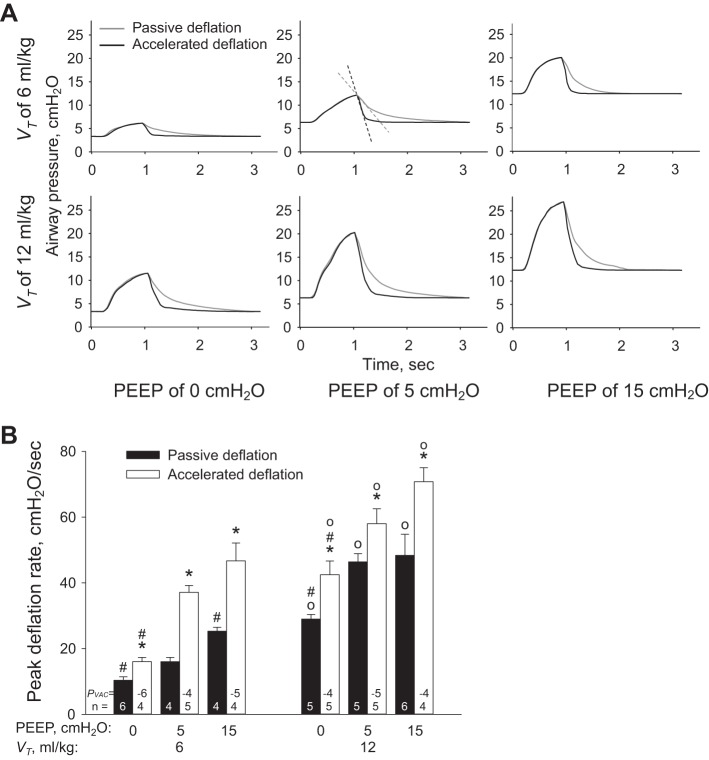
We show the effect of ventilation conditions on ventilation pressure trace in Fig. 5A and report peak deflation rates in Fig. 5B. In the absence or presence of vacuum application, increasing PEEP or VT increases peak deflation rate. For any combination of PEEP and VT, vacuum application increases peak deflation rate. Vacuum application also decreases the time from the start of deflation to the occurrence of peak deflation rate from 0.04–0.12 s to 0.04–0.08 s.
Fig. 5.
Ventilation setting effects on peak deflation rate in local edema model. A: example ventilation pressure traces for all ventilation conditions. Top, middle: for positive end-expiratory pressure (PEEP) of 5 cmH2O and tidal volume, VT, of 6 ml/kg, gray and black dashed lines indicate peak deflation rates for passive and accelerated deflation, respectively. In isolated lungs, minimal PAW is not equal to PEEP; see Wu et al. (24) for relation between PAW and PEEP. B: group peak deflation rate data for all ventilation conditions. PVAC is vacuum pressure applied to accelerate deflation. *P < 0.05 vs. passive deflation with same PEEP and VT; #P < 0.05 vs. PEEP of 5 cmH2O with same VT and deflation type; ○P < 0.05 vs. VT of 6 ml/kg with same PEEP and deflation type.
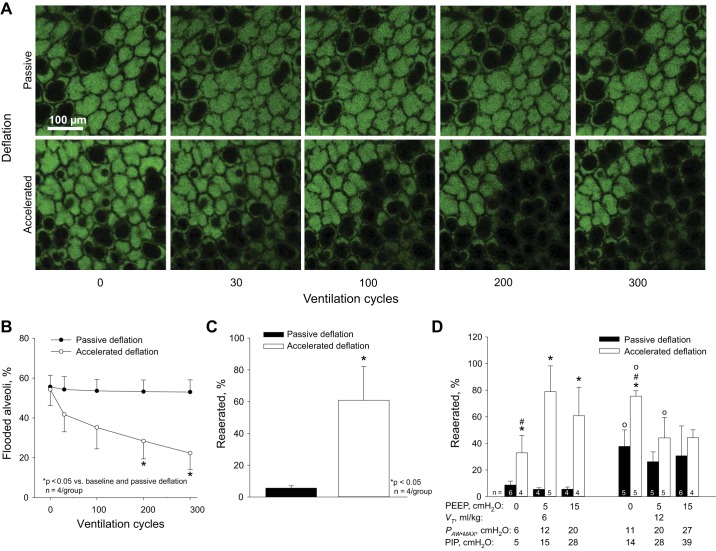
To investigate the effect of accelerated deflation on reaeration of flooded alveoli, we quantify the fraction of flooded alveoli in fluorescent images of the lung surface. At baseline in the local edema model, 53 ± 7% (n = 8) of alveoli are flooded. In the absence of accelerated deflation, ventilation with PEEP of 15 cmH2O and VT of 6 ml/kg fails to reduce the fraction of flooded alveoli (Fig. 6, A and B). With accelerated deflation, 300 ventilation cycles with the same PEEP and VT decrease the fraction of flooded alveoli to 22 ± 8% (Fig. 6, A and B), thus causing 60 ± 6% reaeration (Fig. 6C). We observe that reaerated alveoli are always in contact with at least one initially aerated alveolus, never in the center of a flooded region. This observation suggests that momentum may be most effectively transferred to flooded alveoli by the overdistended septa of adjacent aerated alveoli (16). It also suggests an explanation for our observation that individual flooded alveoli, entirely surrounded by aerated alveoli, are most likely spontaneously to reaerate (Fig. 2). With aerated alveoli all around them, individual flooded alveoli should be subjected to greater stress and should be less stable, even at constant inflation pressure, than flooded alveoli surrounded by a combination of aerated and flooded alveoli.
Fig. 6.
Accelerated deflation promotes reaeration in local edema model. A: example images of local edema model regions ventilated with PEEP of 15 cmH2O and VT of 6 ml/kg without or with accelerated deflation. Fluorescein-labeled albumin solution fills flooded alveoli and lines perimeters of aerated alveoli. Air and alveolar septal tissue are black. B: group alveolar flooding data for same conditions as in A. C: data from final time point of B reported in alternative percentage reaerated format. D: effects of ventilation settings and accelerated deflation on percentage reaerated. PAW⋅MAX is maximal airway pressure in the isolated lungs. Peak inspiratory pressure (PIP) is an estimate of the equivalent maximal airway pressure in a closed-chest preparation (14, 24). *P < 0.05 vs. passive deflation with same PEEP and VT; #P < 0.05 vs. PEEP of 5 cmH2O with same VT and deflation type; ○P < 0.05 vs. VT of 6 ml/kg with same PEEP and deflation type.
With passive, but not accelerated deflation, the trend in reaeration (Fig. 6D) approximates that in the peak deflation rate (Fig. 5B). With passive deflation, reaeration, like peak deflation rate, is greater at higher VT. We attribute the similarity in reaeration and peak deflation rate trends to the higher lung recoil at PAW⋅MAX with higher VT. With accelerated deflation, reaeration does not follow the same trend as peak deflation rate but, rather, is greatest with a low PAW⋅MAX of 12 cmH2O, approximately equivalent to a peak inspiratory pressure of 15 cmH2O in a closed-chest scenario (14, 24).
We directly consider the relation between reaeration and peak deflation rate in Fig. 7A and note that there appears to be a threshold peak deflation rate of ~33 cmH2O/s required to achieve the highest degree of reaeration. However, a peak deflation rate above this threshold does not guarantee a high degree of reaeration. We further analyze the subset of data for which peak deflation rate exceeds 33 cmH2O/s in Fig. 7B. We find that, in addition to a high peak deflation rate, a low PAW⋅MAX is required to effect a high degree of reaeration. A low PAW⋅MAX maintains a low maximal surface tension at the start of deflation, which ensures a low-pressure barrier at the start of deflation. Thus a low PAW⋅MAX, by keeping ΔPB low, enables a high peak deflation rate to overcome ΔPB and cause reaeration of flooded alveoli.
Fig. 7.
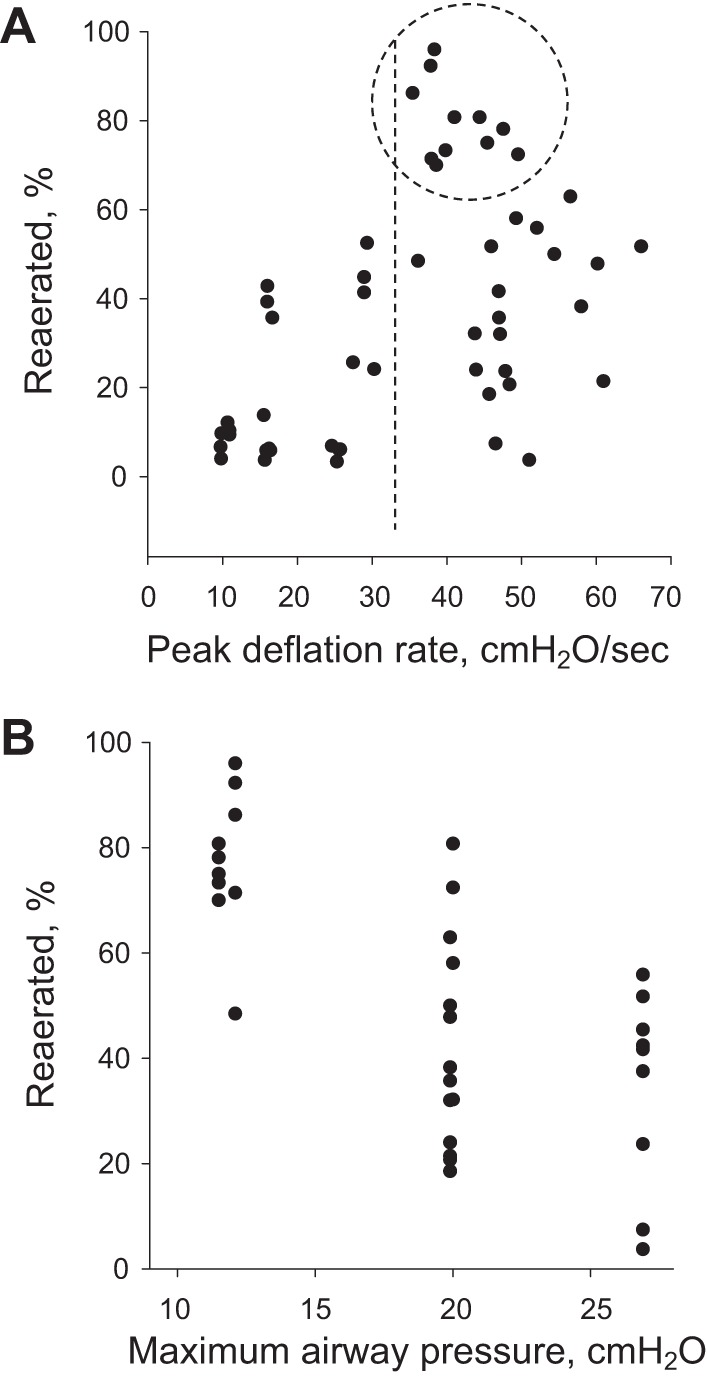
Determinants of reaeration in local edema model. A: percentage reaerated-peak deflation rate relation. Dashed circle encloses points with greatest percentage reaerated. For all points within dashed circle, deflation rate exceeds ~33 cmH2O/s (dashed line). As reaeration percentage is not high for all points to the right of dashed line, high peak deflation rate does not guarantee a high rate of reaeration. B: plot displays only data for which peak deflation rate exceeds 33 cmH2O/s. For these data, percentage reaerated decreases as PAW⋅MAX increases.
The effects of PEEP and VT on reaeration depend on how these ventilation parameters combine to affect peak deflation rate and PAW⋅MAX. With passive deflation, only ventilation with PEEP ≥5 cmH2O and VT of 12 ml/kg causes peak deflation rate to exceed 33 cmH2O/s (Fig. 5B). With these combinations of PEEP and VT, PAW⋅MAX is high and reaeration moderate (Fig. 6D). With passive deflation and either PEEP of 15 cmH2O and VT of 6 ml/kg or PEEP of 0 cmH2O and VT of 12 ml/kg, peak deflation rate is 25–30 cmH2O/s. In the first of these cases, a high PAW⋅MAX of 20 cmH2O prevents reaeration. In the second case, a moderate PAW⋅MAX of 11 cmH2O enables moderate reaeration. With accelerated deflation, ventilation with PEEP of 0 cmH2O and VT of 6 ml/kg has a low peak deflation rate. With a low PAW⋅MAX, moderate reaeration is achieved. Under all other ventilation conditions with accelerated deflation, peak deflation rate is >33 cmH2O/s. Among these groups, combinations of PEEP and VT that minimize PAW⋅MAX maximize reaeration. For these same groups, peak deflation rate generally occurs within one sampling period, 0.04 s, of the start of deflation.
We find that reaeration tends initially to increase and then to decrease flooding heterogeneity. We quantify heterogeneity over time in the three groups with greatest reaeration and find each to exhibit the same trend, which we show for the group with PEEP of 5 cmH2O, VT of 6 ml/kg, and accelerated deflation in Fig. 8A. The net decrease in heterogeneity is not significant after 300 cycles but might become so at a later time point. A plot of flooding heterogeneity vs. the percentage of flooded alveoli that is generated with final time point data from all groups shows that, overall, heterogeneity decreases as the percentage of flooding decreases (Fig. 8B). The plot also suggests a maximum in the heterogeneity-percentage of flooding relation; a quadric fit peaks at 47% flooding, close to the 50% flooding at which one would expect maximum heterogeneity. Reducing the percentage of alveoli that are flooded below 50% should reduce flooding heterogeneity, stress concentration prevalence, and ventilation injury.
Fig. 8.
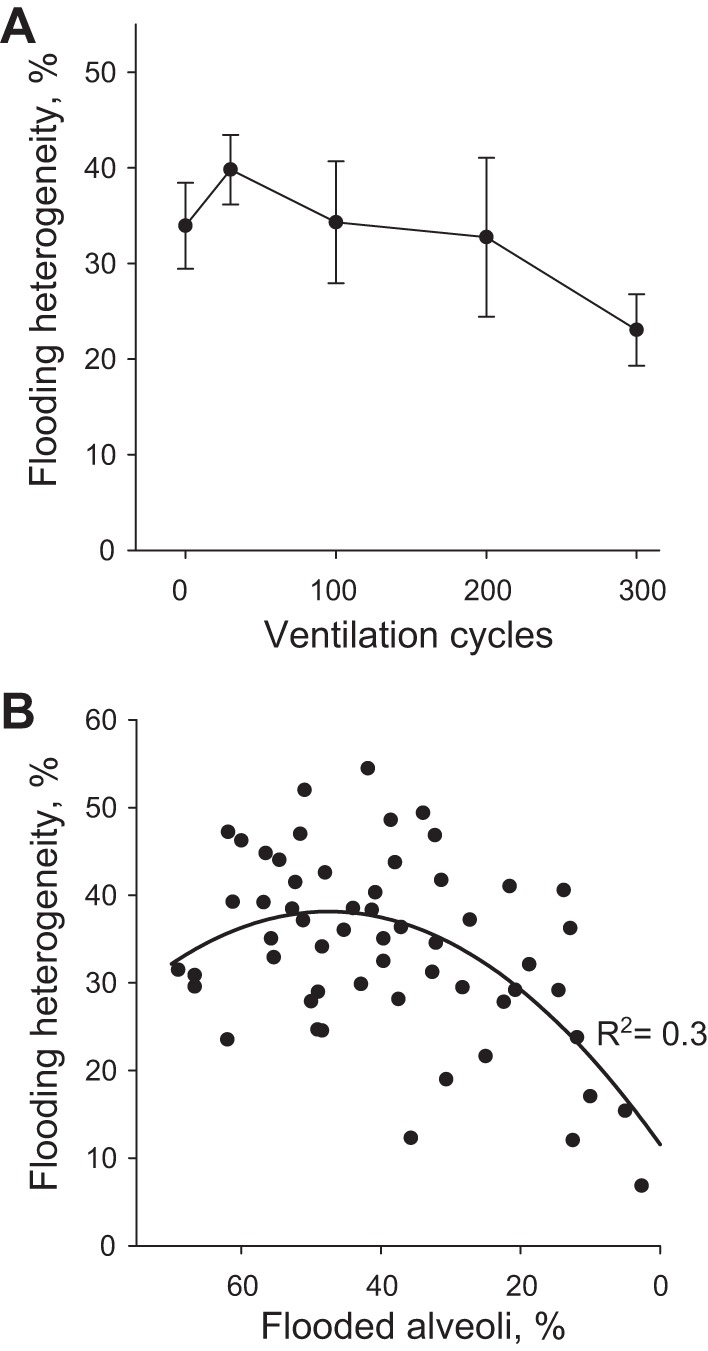
Flooding heterogeneity in local edema model. A: flooding heterogeneity vs. time in PEEP of 15 cmH2O, VT of 6 ml/kg, and accelerated deflation group with greatest percentage reaerated. B: flooding heterogeneity vs. percentage of flooded alveoli. Data from all groups at 300-cycle time point.
Global Edema Model
To establish the global edema model, we first generate global hydrostatic edema in perfused, constantly inflated lungs. At PAW of 15 cmH2O after the establishment of hydrostatic edema, T in flooded alveoli is 12.2 ± 1.6 mN/m (Fig. 9A). This T value does not differ from the T of 11.7 ± 1.1 mN/m in the liquid lining layer of aerated lungs (10). We then arrest perfusion and ventilate the lungs 50 times between PAW of 5 and 10 cmH2O. The ventilation increases T to 18.6 ± 1.3 mN/m. The increase in T should decrease lung compliance and increase deflation rate. However deflation rate, which averages 20.6 ± 1.2 cmH2O/s (n = 3 lungs) over ventilation cycles 3–7, does not change over the course of the 50 cycles (Fig. 9B). It may be that, with this gentle ventilation, the resistance of the outflow track of the ventilation circuit dominates lung recoil in determining deflation rate. The increase in T should also increase the pressure barrier in the global edema model.
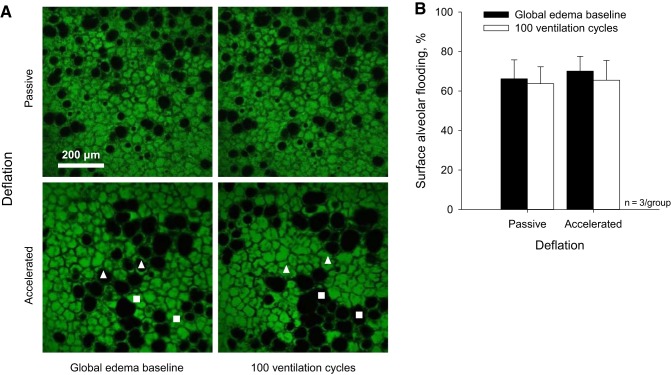
In surface images at the global edema model baseline, 68 ± 8% of alveoli (from 440 μm2 subfields analyzed in surface images of n = 3 global edema model lungs) are flooded (Fig. 12A, left). We note, however, the degree of flooding is markedly heterogeneous across the lung surface and higher than average in the imaged regions. A meniscus is evident in 17 ± 2% of flooded alveoli. The remaining flooded alveoli are flooded beyond the 80-μm subpleural depth to which we image. In alveoli in which a meniscus is evident, the top of the meniscus is located 43 ± 12 μm (n = 20) below the pleural surface. The fraction of alveoli that are flooded and the fraction of flooded alveoli in which the air-liquid interface is below our imaging depth are markedly greater than in the local edema model; when a meniscus is evident, meniscus depth is comparable to that in the local model (10).
Fig. 12.
Effect of accelerated deflation on surface alveolar flooding in global edema model. A: representative images of flooded areas approximately halfway down the side of the costal surface at the global edema model baseline and after 100 ventilation cycles between PAW of 6 and 18 cmH2O. With passive deflation, ventilation does not alter alveolar flooding pattern. With accelerated deflation, ventilation causes liquid to jump between alveoli, thus altering the flooding pattern without altering the number of flooded alveoli. □, initially flooded alveoli that become reaerated; △, initially aerated alveoli that become flooded. B: group data for percentage of flooded alveoli in the imaged surface regions.
In a preliminary set of experiments, we assess the effect of vacuum acceleration on peak deflation rate during ventilation between PAW of 6 and 18 cmH2O in the normal, aerated state and after establishing the global edema model (Fig. 10). In the global edema model, with elevated T, the passive deflation rate in the absence of vacuum application is increased above that in the normal lungs. With vacuum application, deflation rate is elevated above baseline in the normal and global edema model lungs. Maximal deflation rate does not differ significantly between the normal and global edema model lungs.
Fig. 10.
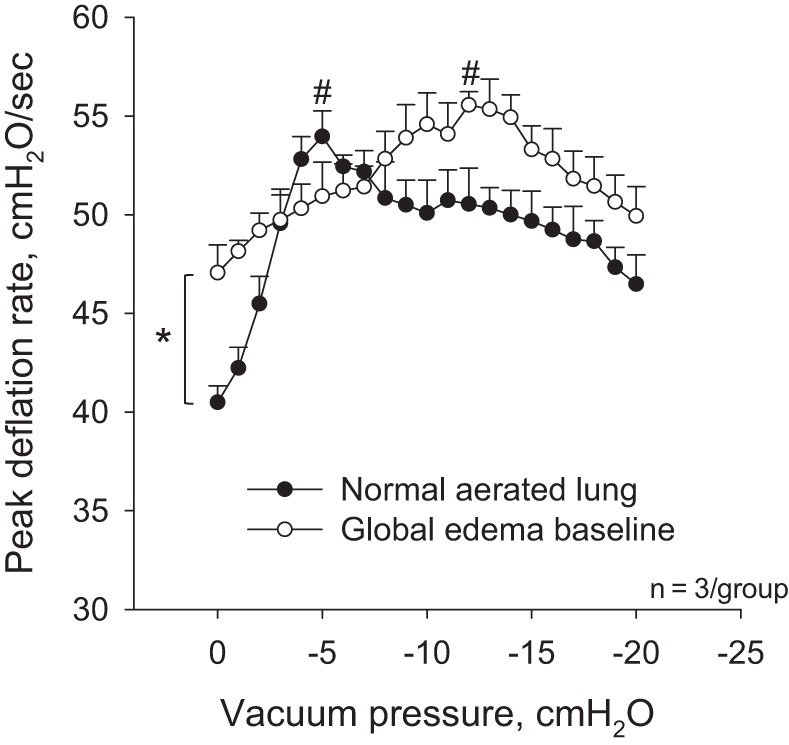
Effect of vacuum application on peak deflation rate during ventilation between PAW of 6 and 18 cmH2O in normal, aerated lungs and after establishment of global edema model. *P < 0.05 in absence of acceleration between normal and global edema model states; #P < 0.05 vs. unaccelerated condition in same state.
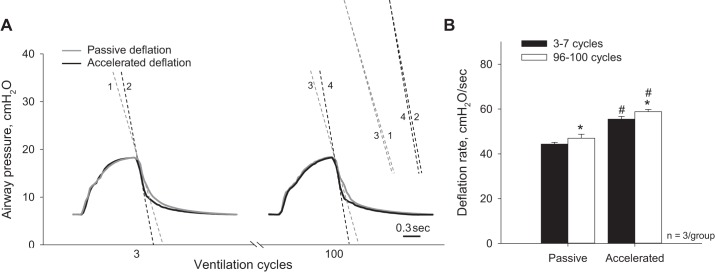
After establishing the global edema model baseline, 100 ventilation cycles between PAW of 6 and 18 cmH2O increase deflation rate by 6% over time regardless of vacuum application (Fig. 11). The increase in deflation rate over the 100 cycles indicates that lung mechanics further deteriorate over the ventilation period. With passive deflation, the flooding pattern in surface alveoli remains constant over the 100 cycles (Fig. 12). This result suggests that the elevated passive deflation rate is not sufficient to overcome the also elevated pressure barrier. With accelerated deflation, the percentage of flooded alveoli remains constant over time. However the flooding pattern changes. In two of three accelerated deflation experiments in the global edema model, compared with none of the accelerated deflation experiments in the local edema model, flooding liquid jumps between surface alveoli. We interpret that vacuum application increases deflation rate sufficiently to overcome the higher pressure barrier in the global edema model. However the elevated T of the global edema model appears to keep liquid aggregated such that escaped liquid moves en masse to another alveolus rather than spreading out more homogeneously among the liquid lining layers of multiple alveoli.
Fig. 11.
Effects of vacuum application and time on ventilation pressure traces in global edema model. A: representative airway pressure traces from cycles 3 and 100, without and with accelerated deflation, during ventilation between PAW of 6 and 18 cmH2O. Dashed lines indicate peak deflation rates and are reproduced at right to show change in deflation rate with time. B: after establishing global edema model baseline, 100 ventilation cycles, without or with accelerated deflation, increase peak deflation rate. *P < 0.05 vs. 3–7 cycles; #P < 0.05 vs. passive deflation.
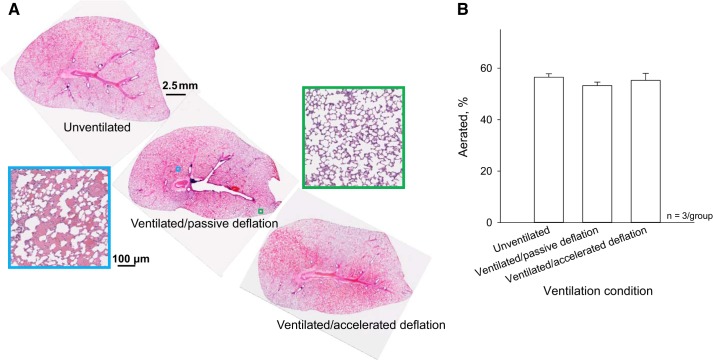
In control lungs fixed at the global edema model baseline and lungs ventilated 100 times between PAW of 6 and 18 cmH2O, without or with vacuum acceleration, we also assess interior alveolar flooding in histological sections. In all groups, flooding heterogeneity is evident on two scales. There are regions with marked flooding and others without flooding (Fig. 13A). Within flooded regions, the alveolar flooding pattern is heterogeneous. We do not observe alveolar collapse as has been reported in other lung injury studies (19, 26), perhaps because of the short time course of the present study. We do not observe airway flooding, as all large flooded tubular structures are deficient in columnar epithelium and surrounded by interstitial cuffing, thus are vessels. The flooding pattern in the histological sections does not vary hydrostatically. It may be that rat lungs have insufficient height for development of a hydrostatic gradient or that anatomy, as well as gravity, affects edema liquid distribution (2).
Fig. 13.
Effect of accelerated deflation on internal alveolar flooding in global edema model. A: sagittal plane histological sections from left lung, about a third of the way from median plane through transverse lung thickness, at the global edema model baseline and after 100 ventilation cycles between PAW of 6 and 18 cmH2O without or with accelerated deflation. Sections are shown with costal surface upward, as during experiments. Enlargements show representative aerated (green) and flooded (cyan) regions. B: group data for air space fraction of section, excluding large airways and vessels.
Over the 100 ventilation cycles, vacuum application does not alter the percentage of the histological section that is aerated (Fig. 13B). As detailed in materials and methods, an increase in the fraction of the section that is aerated would have indicated more homogeneous liquid redistribution. It may be that liquid jumps between alveoli, as in the surface images, without altering the fraction of the section that is aerated. With unpaired histological sections from different lungs at baseline and after ventilation, however, we are unable to identify ventilation-induced fluid movement independent of an alteration in flooding heterogeneity.
Given that the lungs are disconnected from the perfusion circuit before ventilation, ventilation should not alter the amount of liquid in the lungs. As expected, ventilation does not alter the wet-to-dry ratio of the lungs, which is 10.0 ± 0.4, 10.0 ± 0.3, and 9.4 ± 0.3 at global edema model baseline and after 100 ventilation cycles without or with accelerated deflation, respectively.
DISCUSSION
We previously demonstrated that mechanical ventilation increases alveolar-capillary barrier permeability without altering T in local lung regions with heterogeneous alveolar flooding (10, 24). In the present study, we find that ventilation of lungs with global heterogeneous flooding is markedly more injurious; 50 ventilation cycles raise T by 52% (Fig. 9A). This finding elucidates a positive-feedback mechanism through which ventilation injury of globally edematous lungs increases over time. Ventilation exacerbates stress concentrations present between aerated and flooded alveoli, thus causing injury and increasing T. Increased T increases stress concentration magnitude such that ventilation injury escalates over time.
Liquid Escape from Flooded Alveoli
In the local edema model, we see liquid escape from flooded alveoli and tend to redistribute more homogeneously. In the global edema model, we see liquid jump between surface alveoli without a reduction in flooding heterogeneity. It could be that escaped liquid in the local model drains into surrounding aerated regions that are not present in the global model. However, to generate the local model, we inject ~300 nl of liquid. If this volume flooded all alveoli in a hemispherical region centered about the injected alveolus, the flooded region would have a radius of just over 500 μm. Given that 53% of alveoli in our analysis field are flooded, the radius of the flooded region in the local model should exceed 600 μm. In the local model, flooding should be significant in regions surrounding the analysis field. Thus the reaeration that we observe at the center of the local model is not likely attributable to liquid drainage into nearby, aerated regions. The difference in availability of aerated lung tissue does not likely explain the difference in liquid redistribution patterns between the local and global models. Rather, we suggest that normal T in the local model likely enables escaped liquid to spread out and redistribute more homogeneously; elevated T in the global model keeps escaped liquid aggregated, such that it jumps en masse to another alveolus.
In the local and global models, we observe flooded alveoli to become reaerated over the course of 100 ventilation cycles. If we were to observe the lungs continuously during ventilation, we would likely find this ventilation-induced reaeration, like occasional spontaneous reaeration (Fig. 2), to occur instantaneously. Given the rapid timing of the reaeration that we observe, the phenomenon is distinct from the slower reabsorption of liquid into the interstitium, which occurs over hours to days (12). Furthermore, the observation that liquid jumps between alveoli in the global model supports the concept that liquid is redistributed within the airspace of the lungs, not reabsorbed into the interstitium. Although we do not quantify liquid reabsorption into the interstitium, the extent of any such reabsorption is likely negligible over the short time course of our experiments. Given that just five mechanical ventilation cycles can injure the alveolar-capillary barrier in regions with heterogeneous alveolar flooding (24), the ability rapidly to promote homogeneous alveolar liquid distribution is desirable.
In the local edema model, the liquid that escapes from flooded alveoli seems to disappear. For the reasons detailed above, the liquid likely remains in the airspace of the lungs. With low T in the local model, the escaped liquid is more likely to spread out across the regional liquid lining layer than to aggregate in an alveolus or a duct. Alveolar ducts, with walls composed of alveolar entrance rings, have little surface area (1). The alveoli, with their large surface area, are the principal location of the liquid lining layer. Thus we expect that escaped liquid redistributes across regional alveoli. This expectation requires confirmation.
If more homogeneous edema liquid redistribution could be effectively implemented, ventilation injury would be expected to decrease at the expense of a thickened liquid lining layer that might reduce oxygenation. With more homogeneous flooding, however, it might be possible to ventilate the lungs with a slightly greater pressure or volume. We also note that increasing flooding homogeneity early during ventilation of the edematous lung might, by reducing subsequent ventilation injury, reduce future airspace flooding and limit any future decrease in oxygenation.
Global Edema Model
To establish the global edema model, we first generate hydrostatic edema in perfused, constantly inflated lungs. Generation of hydrostatic edema does not alter T from the normal 12 mN/m at a transpulmonary pressure of 15 cmH2O. We then arrest perfusion and ventilate the lungs 50 times between PAW of 5 and 10 cmH2O to injure the lungs. The injury increases T to 19 mN/m at the same transpulmonary pressure (Fig. 9A). With ongoing perfusion, ventilation might increase airspace flooding as well as T.
In the global edema model, alveolar liquid protein concentration is likely elevated. We base this assumption on our reanalysis (24) of data from Gunther et al. (6) showing that alveolar liquid protein concentration is the same, 5%, in cardiogenic pulmonary edema and ARDS patients. We suggest that with stress concentrations present due to heterogeneous alveolar flooding, ventilation may injure the alveolar-capillary barrier and allow protein entrance into initially nonproteinaceous alveolar liquid. Nonetheless, we do not attribute the increase in T in the present global edema model to the presence of plasma proteins. In the local edema model, we previously found that that the presence of plasma proteins in the flooding solution does not alter T over 60 ventilation cycles so long as cyclic surface area compression is kept within the pathophysiological range (10). Instead of plasma proteins, it may be cell membrane lipids that raise alveolar liquid T in the present global model. Altered phospholipid profiles have been identified in bronchoalveolar lavage fluid from patients with ARDS (6, 7, 17). During global edema model generation in the present study, ventilation-induced exacerbation of stress concentrations in regions with heterogeneous flooding should damage the alveolar-capillary barrier (24). Membrane lipids from damaged cells may adsorb to the interface and interfere with surfactant function (8).
During global edema model generation, ventilation of flooded lungs with initially normal T causes a 52% increase in T (Fig. 9A). In the local edema model, ventilation causes sufficient injury to increase alveolar-capillary barrier permeability in a sustained fashion but insufficient injury to increase T (10, 24). To reconcile our results from the two models, we consider that in the local model the flooded region is a small portion of the whole lung and that the rest of the lung has normal compliance. The surrounding, normal lung tissue likely acts as a damper and minimizes the stress that ventilation imposes on the flooded region. The increased injury in the global model might be explained if compliance were decreased throughout the lungs, such that damping were decreased and stress concentrations increased.
Does flooding decrease lung compliance when T is normal, such as after establishing hydrostatic edema in unventilated lungs? Lung tissue stiffness has been found unchanged in edematous lungs (5). But with heterogeneous flooding, septa at the site of stress concentration between aerated and flooded alveoli are more distended than normal at a given lung volume and should thus be operating along a stiffer portion of the nonlinear stress-strain curve. We have shown previously that shrunken flooded alveoli exhibit normal effective compliance (change in cross-sectional area relative to change in inflation pressure), but adjacent overexpanded aerated alveoli exhibit reduced effective compliance (16). Consequently net regional compliance is reduced at a given lung volume although tissue properties are unchanged. With more sites of stress concentration throughout the globally edematous lungs, damping may be reduced. As a result, stress concentration magnitude may be greater and ventilation more injurious.
Vacuum Acceleration
The effect of vacuum acceleration on peak deflation rate (Fig. 10) suggests that our isolated lung preparation may exhibit flow limitation and negative effort dependence (13, 21, 22). Flow limitation is the existence of a maximal achievable airflow rate out of the lungs at fixed lung volume and attributed to partial airway collapse in the presence of a negative transmural pressure difference. Transmural pressure difference becomes negative in certain airway segments when PALV > PPL > PAW, where PPL is pleural pressure, during forced expiration in a closed-chest scenario or with isolated lungs studied in a plethysmograph. However, in the isolated lungs in which we work, PALV > PAW > PPL = 0 such that transmural pressure difference should remain positive.
The response of peak deflation rate to vacuum acceleration in our model is more likely attributable to the fact that peak deflation rate may occur at different lung volumes with application of different vacuum pressures. Vacuum application increases lung deflation rate. With faster deflation of the lungs, the lungs may be at a lower volume at the time of peak deflation rate. At a lower volume, lung recoil is reduced and airway resistance elevated such that peak deflation rate should be lower. Thus, through different mechanisms, vacuum application tends both to increase and to decrease peak deflation rate. These dual tendencies may explain why increasing vacuum application first increases and then decreases peak deflation rate.
Conclusion
We test accelerated deflation in local and global edema models with normal and high surface tension, respectively. Accelerated deflation promotes liquid escape from flooded alveoli in both models, but only with normal T in the local model does the fraction of flooded alveoli tend to decrease. With global edema and relatively normal T, use of accelerated deflation from the start of mechanical ventilation might reduce stress concentration prevalence, thus reduce the degree of ventilation injury. Normal T might be present before mechanical ventilation in cardiogenic pulmonary edema. Whether T is normal or elevated before ventilation in ARDS is not presently known. In any scenario, accelerated deflation would act synergistically with a decrease in T and thus be most effective if employed coincidentally with a therapy that reduced T.
GRANTS
This work was supported by National Heart, Lung and Blood Institute Grant HL-113577.
DISCLOSURES
No conflicts of interest, financial or otherwise, are declared by the authors.
AUTHOR CONTRIBUTIONS
Y.W., T.L.N., and C.E.P. conceived and designed research; Y.W. performed experiments; Y.W., T.L.N., and C.E.P. analyzed data; Y.W., T.L.N., and C.E.P. interpreted results of experiments; Y.W. and C.E.P. prepared figures; Y.W. and C.E.P. drafted manuscript; Y.W., T.L.N., and C.E.P. edited and revised manuscript; Y.W., T.L.N., and C.E.P. approved final version of manuscript.
APPENDIX: MECHANISM THROUGH WHICH ACCELERATED DEFLATION PROMOTES LIQUID ESCAPE FROM FLOODED ALVEOLI
At the start of accelerated lung deflation, the magnitude of dPAW/dt quickly increases from zero to a maximal value (Fig. 5A). The magnitude of the rate of septal tissue contraction must, likewise, quickly increase from zero. During this rapid deflation period, the lung tissue transiently applies an additional force to the liquid in a flooded alveolus. The liquid in a flooded alveolus applies an equal and opposite additional force, ΔF, to the lung tissue, and ΔF equals the time derivative of the momentum of the liquid:
where is momentum; subscript i indicates an initial time point at the start of deflation; and subscript f indicates a time point Δt later. Furthermore, ΔF = ΔP⋅A, where ΔP is the increase in alveolar liquid pressure caused by lung deflation and A is cross-sectional area of the alveolar liquid; , where mAlv liq is the mass of liquid in the flooded alveolus and vAlv liq f is the velocity of the alveolar liquid relative to the lung tissue of septa connected to and radiating away from the flooded alveolus at time Δt; and , given that the velocity of the alveolar liquid relative to the lung tissue is zero at the start of deflation. Thus,
Consider lung deflation from PAW of 15 cmH2O. The liquid in a flooded alveolus has A of ~6.6 × 103 μm2 and, if alveoli are flooded with water to an average depth of ~80 μm, mAlv liq is ~5.3 × 10⁻⁷ g (16). With accelerated deflation, deflation rate reaches a maximal value within one sampling period of Δt = 0.04 s after the start of deflation. Considering that deflation of the normal, aerated lungs from PAW of 15 to 5 cmH2O reduces average alveolar perimeter length from ~337 to 295 μm (15), deflation at a rate of 33 cmH2O/s contracts lung septa at ~139 μm/s. With surrounding septa contracting at 139 μm/s, the flooding liquid is moving toward the lung tissue at the same rate, and vAlv liq f is ~139 μm/s. Thus ΔP ≈2.9 × 10⁻⁶ cmH2O.
As we do not account for the extra extension of septa in overexpanded aerated alveoli that are adjacent to and likely the source of momentum transfer to flooded alveoli that become reaerated, 139 μm/s is likely an underestimate of vAlv liq f, making the value we calculate for ΔP also an underestimate.
We note that the concept of the pressure barrier is derived from a static force balance. Under static conditions, with an inflection point in the curvature of the air-liquid interface between the center and border of the flooded alveolus, the pressure barrier will always be positive. We do not know how the dynamics of accelerated deflation alter interfacial geometry or liquid phase pressure distribution. Nonetheless, we find experimentally that accelerated deflation causes reaeration of flooded alveoli and estimate here the degree to which accelerated deflation increases liquid pressure in the flooded alveolus. Our calculation suggests that the order of magnitude of ΔP is very small. That such a small increase in pressure can enable ΔPB to be overcome and flooded alveoli to become reaerated indicates that the magnitude of ΔPB must also be very small. A ΔPB on the order of 10−6 cmH2O may explain the occasional spontaneous reaeration of the individual, flooded alveolus.
REFERENCES
- 1.Bachofen H, Schürch S. Alveolar surface forces and lung architecture. Comp Biochem Physiol A Mol Integr Physiol 129: 183–193, 2001. doi: 10.1016/S1095-6433(01)00315-4. [DOI] [PubMed] [Google Scholar]
- 2.Bachofen H, Schürch S, Michel RP, Weibel ER. Experimental hydrostatic pulmonary edema in rabbit lungs. Morphology. Am Rev Respir Dis 147: 989–996, 1993. doi: 10.1164/ajrccm/147.4.989. [DOI] [PubMed] [Google Scholar]
- 3.Bastacky J, Lee CY, Goerke J, Koushafar H, Yager D, Kenaga L, Speed TP, Chen Y, Clements JA. Alveolar lining layer is thin and continuous: Low-temperature scanning electron microscopy of rat lung. J Appl Physiol 79: 1615–1628, 1995. [DOI] [PubMed] [Google Scholar]
- 4.Brower RG, Matthay MA, Morris A, Schoenfeld D, Thompson BT, Wheeler A; The Acute Respiratory Distress Syndrome Network . Ventilation with lower tidal volumes as compared with traditional tidal volumes for acute lung injury and the acute respiratory distress syndrome. N Engl J Med 342: 1301–1308, 2000. doi: 10.1056/NEJM200005043421801. [DOI] [PubMed] [Google Scholar]
- 5.Cook CD, Mead J, Schreiner GL, Frank NR, Craig JM. Pulmonary mechanics during induced pulmonary edema in anesthetized dogs. J Appl Physiol 14: 177–186, 1959. [DOI] [PubMed] [Google Scholar]
- 6.Günther A, Siebert C, Schmidt R, Ziegler S, Grimminger F, Yabut M, Temmesfeld B, Walmrath D, Morr H, Seeger W. Surfactant alterations in severe pneumonia, acute respiratory distress syndrome, and cardiogenic lung edema. Am J Respir Crit Care Med 153: 176–184, 1996. doi: 10.1164/ajrccm.153.1.8542113. [DOI] [PubMed] [Google Scholar]
- 7.Hallman M, Spragg R, Harrell JH, Moser KM, Gluck L. Evidence of lung surfactant abnormality in respiratory failure. Study of bronchoalveolar lavage phospholipids, surface activity, phospholipase activity, and plasma myoinositol. J Clin Invest 70: 673–683, 1982. doi: 10.1172/JCI110662. [DOI] [PMC free article] [PubMed] [Google Scholar]
- 8.Holm BA, Notter RH. Effects of hemoglobin and cell membrane lipids on pulmonary surfactant activity. J Appl Physiol 63: 1434–1442, 1987. [DOI] [PubMed] [Google Scholar]
- 9.Kaner RJ, Ladetto JV, Singh R, Fukuda N, Matthay MA, Crystal RG. Lung overexpression of the vascular endothelial growth factor gene induces pulmonary edema. Am J Respir Cell Mol Biol 22: 657–664, 2000. doi: 10.1165/ajrcmb.22.6.3779. [DOI] [PubMed] [Google Scholar]
- 10.Kharge AB, Wu Y, Perlman CE. Surface tension in situ in flooded alveolus unaltered by albumin. J Appl Physiol 117: 440–451, 2014. doi: 10.1152/japplphysiol.00084.2014. [DOI] [PMC free article] [PubMed] [Google Scholar]
- 11.Kharge AB, Wu Y, Perlman CE. Sulforhodamine B interacts with albumin to lower surface tension and protect against ventilation injury of flooded alveoli. J Appl Physiol 118: 355–364, 2015. doi: 10.1152/japplphysiol.00818.2014. [DOI] [PMC free article] [PubMed] [Google Scholar]
- 12.McAuley DF, Frank JA, Fang X, Matthay MA. Clinically relevant concentrations of beta2-adrenergic agonists stimulate maximal cyclic adenosine monophosphate-dependent airspace fluid clearance and decrease pulmonary edema in experimental acid-induced lung injury. Crit Care Med 32: 1470–1476, 2004. doi: 10.1097/01.CCM.0000129489.34416.0E. [DOI] [PubMed] [Google Scholar]
- 13.Mead J, Turner JM, Macklem PT, Little JB. Significance of the relationship between lung recoil and maximum expiratory flow. J Appl Physiol 22: 95–108, 1967. [DOI] [PubMed] [Google Scholar]
- 14.Pelosi P, Goldner M, McKibben A, Adams A, Eccher G, Caironi P, Losappio S, Gattinoni L, Marini JJ. Recruitment and derecruitment during acute respiratory failure: An experimental study. Am J Respir Crit Care Med 164: 122–130, 2001. doi: 10.1164/ajrccm.164.1.2007010. [DOI] [PubMed] [Google Scholar]
- 15.Perlman CE, Bhattacharya J. Alveolar expansion imaged by optical sectioning microscopy. J Appl Physiol 103: 1037–1044, 2007. doi: 10.1152/japplphysiol.00160.2007. [DOI] [PubMed] [Google Scholar]
- 16.Perlman CE, Lederer DJ, Bhattacharya J. Micromechanics of alveolar edema. Am J Respir Cell Mol Biol 44: 34–39, 2011. doi: 10.1165/rcmb.2009-0005OC. [DOI] [PMC free article] [PubMed] [Google Scholar]
- 17.Pison U, Seeger W, Buchhorn R, Joka T, Brand M, Obertacke U, Neuhof H, Schmit-Neuerburg KP. Surfactant abnormalities in patients with respiratory failure after multiple trauma. Am Rev Respir Dis 140: 1033–1039, 1989. doi: 10.1164/ajrccm/140.4.1033. [DOI] [PubMed] [Google Scholar]
- 18.Rodriguez M, Bur S, Favre A, Weibel ER. Pulmonary acinus: Geometry and morphometry of the peripheral airway system in rat and rabbit. Am J Anat 180: 143–155, 1987. doi: 10.1002/aja.1001800204. [DOI] [PubMed] [Google Scholar]
- 19.Santiago VR, Rzezinski AF, Nardelli LM, Silva JD, Garcia CS, Maron-Gutierrez T, Ornellas DS, Morales MM, Capelozzi VL, Marini J, Pelosi P, Rocco PR. Recruitment maneuver in experimental acute lung injury: The role of alveolar collapse and edema. Crit Care Med 38: 2207–2214, 2010. doi: 10.1097/CCM.0b013e3181f3e076. [DOI] [PubMed] [Google Scholar]
- 20.Staub NC, Nagano H, Pearce ML. Pulmonary edema in dogs, especially the sequence of fluid accumulation in lungs. J Appl Physiol 22: 227–240, 1967. [DOI] [PubMed] [Google Scholar]
- 21.Suzuki S, Sasaki H, Sekizawa K, Takishima T. Isovolume pressure-flow relationships in intrapulmonary bronchi of excised dog lungs. J Appl Physiol Respir Environ Exerc Physiol 52: 295–303, 1982. [DOI] [PubMed] [Google Scholar]
- 22.Takishima T, Sasaki H, Nakamura T. Two dimensional flow model for analysis of expiratory check valve. Tohoku J Exp Med 106: 311–327, 1972. doi: 10.1620/tjem.106.311. [DOI] [PubMed] [Google Scholar]
- 23.Weibel ER. A retrospective of lung morphometry: From 1963 to present. Am J Physiol Lung Cell Mol Physiol 305: L405–L408, 2013. doi: 10.1152/ajplung.00169.2013. [DOI] [PubMed] [Google Scholar]
- 24.Wu Y, Kharge AB, Perlman CE. Lung ventilation injures areas with discrete alveolar flooding, in a surface tension-dependent fashion. J Appl Physiol 117: 788–796, 2014. doi: 10.1152/japplphysiol.00569.2014. [DOI] [PMC free article] [PubMed] [Google Scholar]
- 25.Wu Y, Perlman CE. In situ methods for assessing alveolar mechanics. J Appl Physiol 112: 519–526, 2012. doi: 10.1152/japplphysiol.01098.2011. [DOI] [PubMed] [Google Scholar]
- 26.Zang D, Shao Y, Li X. Ultrastructural pathology of rat lung injury induced by ischemic acute kidney injury. Ultrastruct Pathol 37: 433–439, 2013. doi: 10.3109/01913123.2013.833562. [DOI] [PubMed] [Google Scholar]


