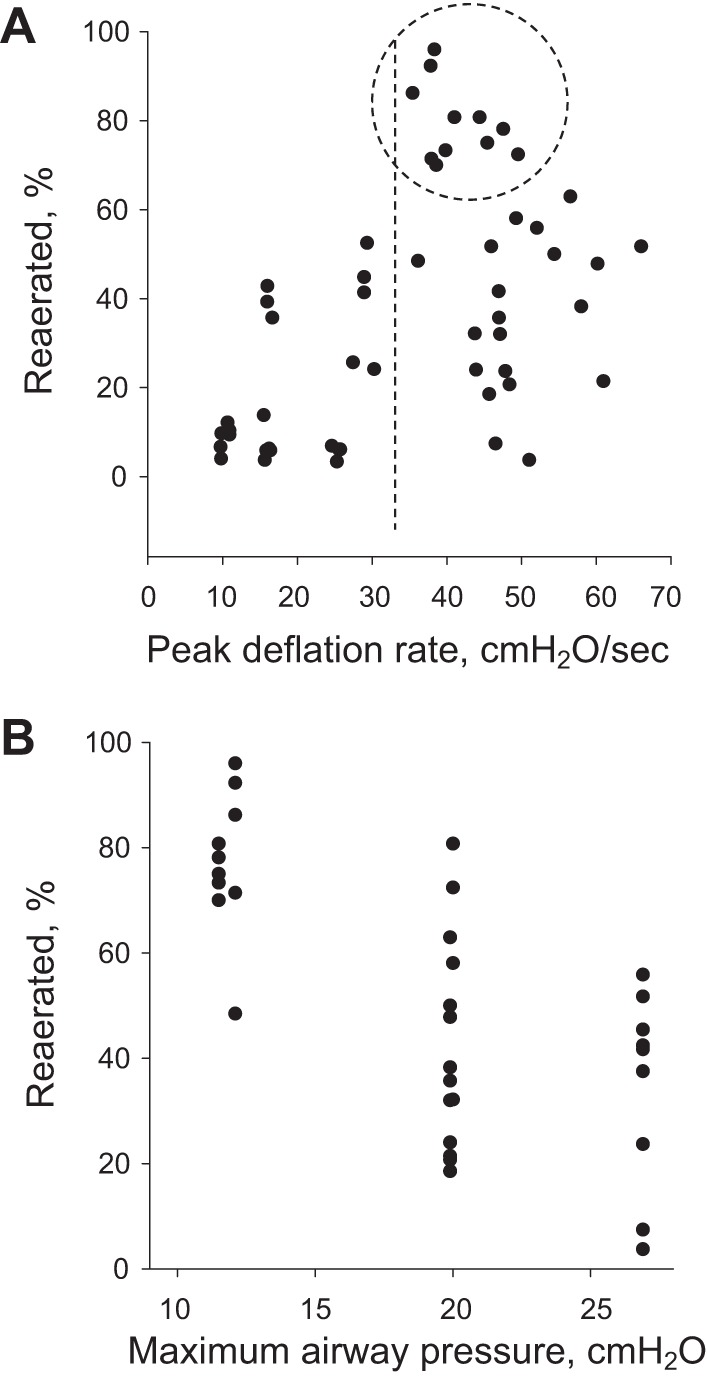
Fig. 7.

Determinants of reaeration in local edema model. A: percentage reaerated-peak deflation rate relation. Dashed circle encloses points with greatest percentage reaerated. For all points within dashed circle, deflation rate exceeds ~33 cmH2O/s (dashed line). As reaeration percentage is not high for all points to the right of dashed line, high peak deflation rate does not guarantee a high rate of reaeration. B: plot displays only data for which peak deflation rate exceeds 33 cmH2O/s. For these data, percentage reaerated decreases as PAW⋅MAX increases.
