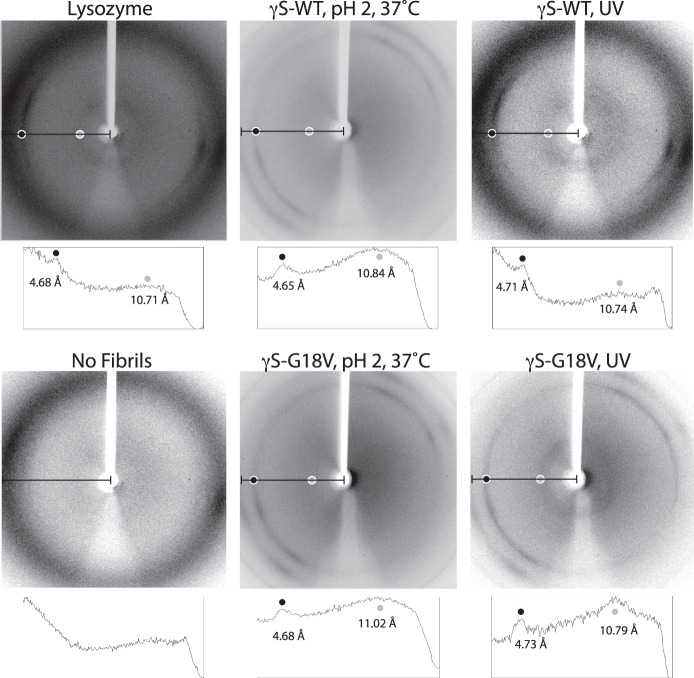
Figure 5.
Representative x-ray diffraction patterns for fibrillar aggregates of γS-WT and γS-G18V. Lysozyme fibrils prepared by incubation at 60°C and pH 2 for 2 days prior to the experiment were used as a positive control. Below each image, its corresponding image intensity profile is shown for the area of the image designated with a black line. Relevant peaks are labeled with their resolution measurement, in angstrom units, and the location of each peak is correlated to the location on the diffraction pattern with light gray or dark gray dots.

