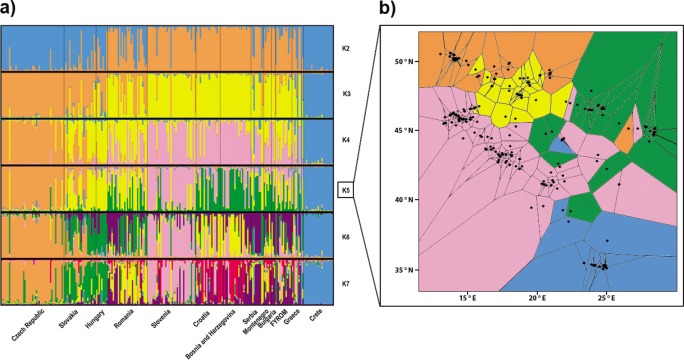
Figure 2. Structuring of the nuclear data.
(A) Population assignment using Bayesian clustering analysis in Structure for the 260 Erinaceus roumanicus samples in Central Europe and the Balkan region. The results are shown for K = 2 to K = 7. The highest ΔK was for K = 3, and the second highest ΔK was for K = 7. (B) Geographical cluster assignments implemented by TESS. The results display five colours for Kmax = 6.

