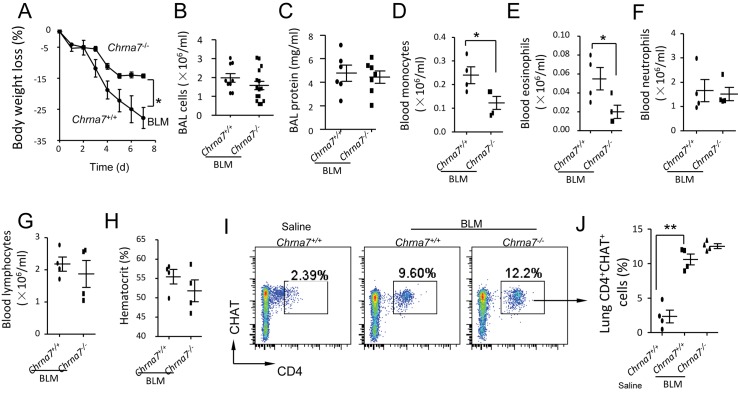
Figure 1.
Deficiency of α7 nAChR affects body-weight loss, BAL and blood profiles, and lung CD4+CHAT+ cells in the early stage of BLM-induced lung fibrosis. (A) Effect of α7 nAChR on body weight loss during BLM-induced lung fibrosis. Chrna7+/+ and Chrna7-/- mice were intratracheally challenged with BLM (3 mg/kg) and Chrna7+/+ mice receiving intratracheal saline were used as control. Body weight was followed for 7 d. *p < 0.05 for BLM-challenged Chrna7-/- versus BLM-challenged Chrna7+/+ mice. (B, C) Effect of α7 nAChR on BAL profiles during BLM-induced lung fibrosis. Experimental protocol was the same as Figure 1A. At 7 d, mice were euthanized and BAL was performed to measure (B) leukocytes and (C) proteins levels. The data were pooled from two independent experiments. N = 6-15 in each group. *p < 0.05 for BLM-challenged Chrna7-/- versus BLM-challenged Chrna7+/+ mice. (D–H) Effect of α7 nAChR on blood profiles during BLM-induced lung fibrosis. Experimental protocol was the same as Figure 1A. At 7 d, mice were euthanized and peripheral blood was collected to measure (D) monocytes, (E) eosinophils, (F) neutrophils, (G) lymphocytes and (H) hematocrit. N = 4. *p < 0.05 for BLM-challenged Chrna7-/- versus BLM-challenged Chrna7+/+ mice. (I–J) Effect of α7 nAChR on percentage of lung acetylcholine-producing CD4+ lymphocytes in the early stage of BLM-induced lung fibrosis. Experimental protocol was the same as Figure 1A. At 7 d, mice were euthanized and lungs were removed and homogenized for isolating cells. The cells were submitted to flow cytometry to analyze CD4+CHAT+ cells. The whole cell population of digested lung cells was used for analysis after excluding doublets or dead cells. The percentage of CD4+CHAT+ cells is shown. N = 4. **p < 0.01 for saline-challenged Chrna7+/+ versus BLM-challenged Chrna7+/+ mice. Data are mean ± SD.

