Figure 5.
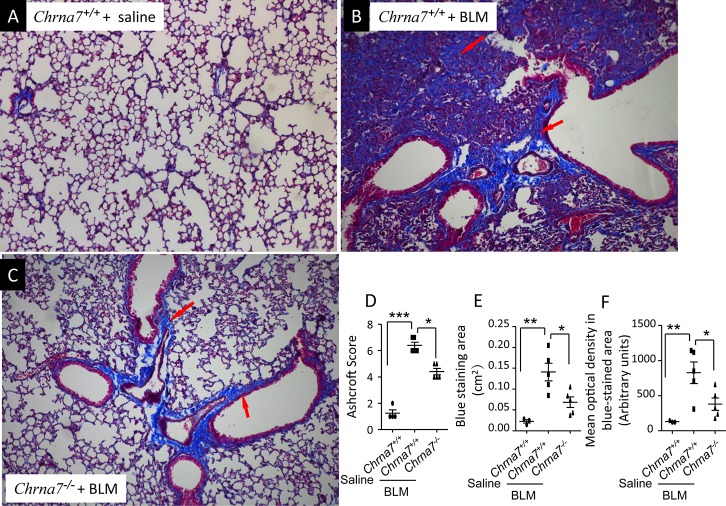
Qualitative and quantitative analysis of Masson′s trichrome staining in established BLM-induced lung fibrosis. (A–C) Representative microphotographs of Masson′s trichrome staining. Chrna7+/+ and Chrna7-/- mice were intratracheally challenged with BLM (0.5 mg/kg) and euthanized at 21 d. Saline-challenged Chrna7+/+ mice were used as controls. (A) Chrna7+/+ + saline, (B) Chrna7+/+ + BLM and (C) Chrna7-/- + BLM. Red arrows indicate positive peribronchial and interstitial staining. Objective magnification was × 10. (D–F) Qualitative and quantitative analysis of Masson′s trichrome staining by Image-Pro Plus software. (D) Analysis of severity of fibrotic lesions by Ashcroft scoring system. (E) Measurements of trichrome staining positive area. (F) Measurements of mean optical density in blue-stained area. N = 4–5 in each group. ***p < 0.001 **p < 0.01, and *p < 0.05 in each comparison. Data are mean ± SD.

