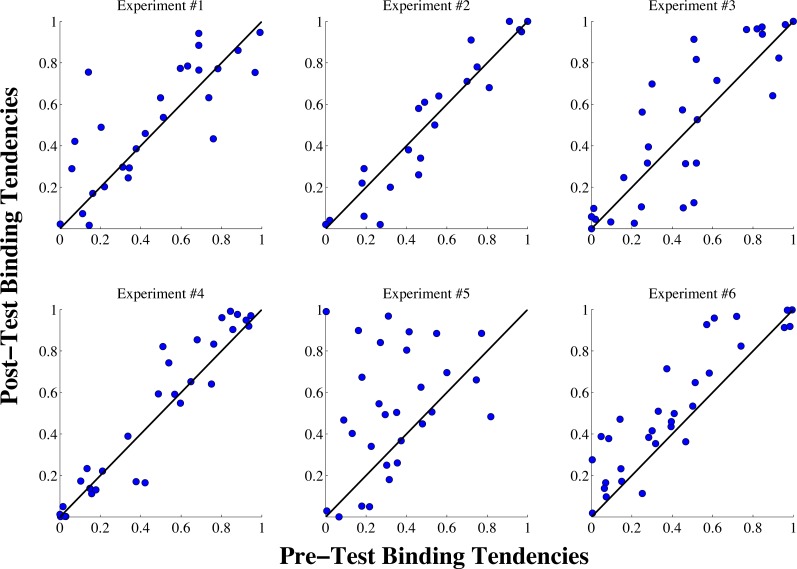
Figure 4. Individual binding tendency scores from the pre-test and post-test sessions for all six experiments.
The blue dots show the binding tendency values for each individual subject, and the black lines show the identity line for each plot, indicating perfect stability of the binding tendency from the pre-test to the post-test session. As can be seen in the figure, in experiments #1–4, with the exception of a few outliers, most subjects exhibited consistent binding tendency scores from the pre-test to the post-test sessions. In experiment #5, most subjects displayed an increase in the binding tendency was displayed in the post-test phase, with some heterogeneity among subjects in this trend. Similarly, an increase in the binding tendency was exhibited by most subjects in experiment #6, but the overall trend was smaller than in Experiment #5.

