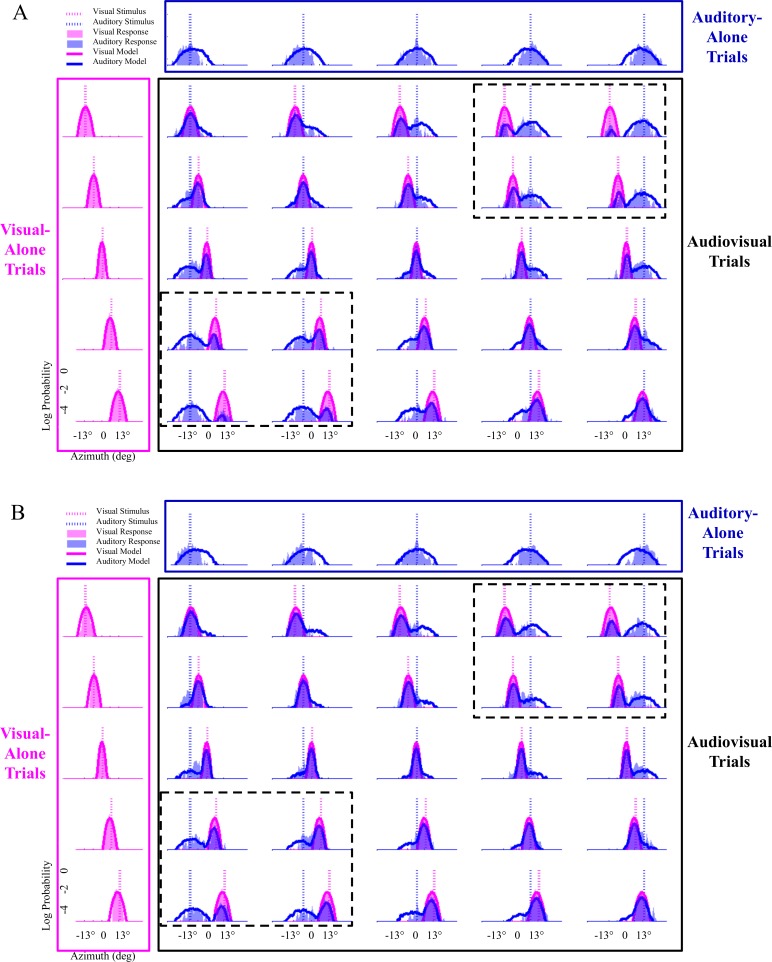
Figure 5. Modeling results with data from all subjects in experiment #5 that were best characterized by the probability-matching strategy.
(A) Pre-test localization data from twenty subjects are shown, with the model fit to all of these subjects’ data at once. Visual-only conditions are shown in the pink boxes, auditory-only conditions in the dark blue boxes, and audiovisual conditions in the black boxes. Audiovisual trials with stimuli played at the same location are along the diagonal in the black box. The bisensory conditions with the highest amount of spatial discrepancy between the visual and auditory stimuli are shown in the black boxes marked by the dotted lines in each figure. (B) Post-test localization data. The conditions in the black boxes with dotted lines clearly reveal the increase in binding tendency from the pre-test to the post-test phase, as the amount of overlap between the pink (visual) and blue (auditory) response distributions increases from the pre-test to the post-test phase, showing that a larger percentage of auditory stimuli were localized where the visual stimuli occurred on these spatially-discrepant trials.

