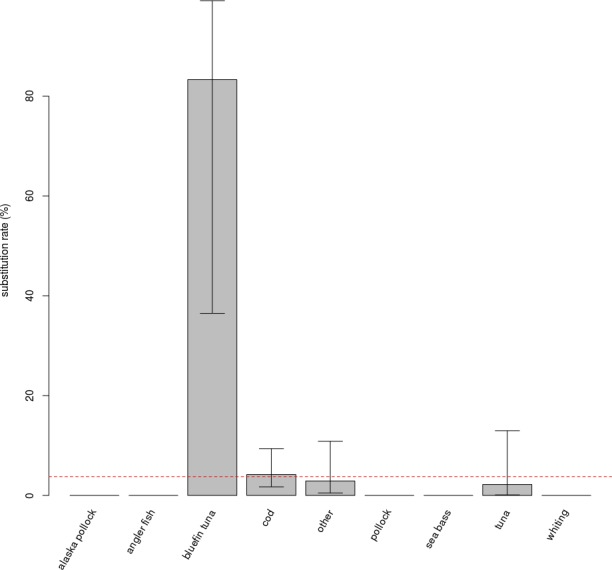
Figure 1. Substitution rates for different commercial name categories.

Species categories with more than 10 samples collected have comparable, low substitution rates; substitutions were observed in only three of the categories. Bluefin tuna displays an exceptionally high substitution rate, and was separated from other tuna species in the figure and in analyses, despite a very low number of samples (n = 6). Error bars show the 95% confidence interval. The red dashed line is the average substitution rate observed for the entire dataset.
