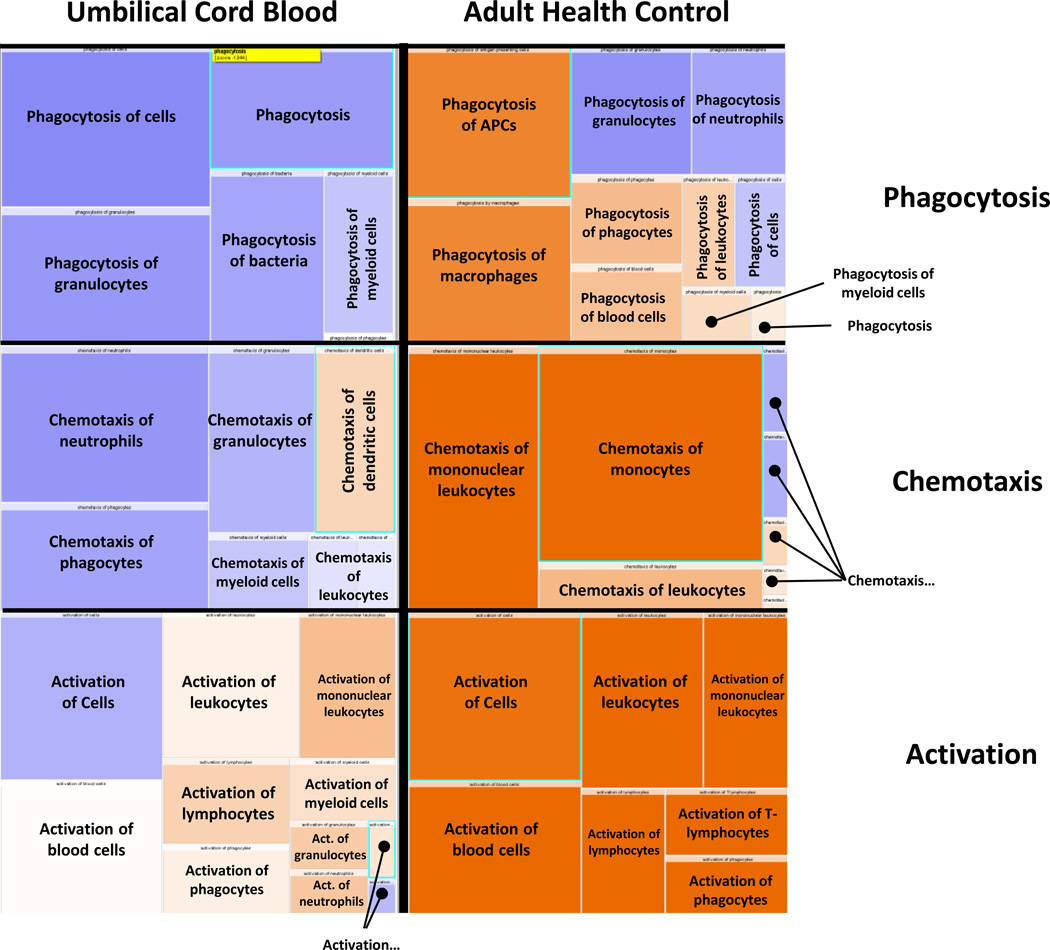
Figure 2. Ingenuity Pathway Analysis (IPA) Downstream Predictions.
IPA software™ was employed to analyze the neutrophil transcriptomic changes in umbilical cord blood (UCB) vs healthy control (HC) from Day 0 to Day 1 after lipopolysaccharide (LPS) incubation. The data shown represent 9,296 genes that are significantly different between the groups (p<0.001 with a fold-change 2 cut-off). Here, the orange represents over-representation of genes (upregulated) and the blue represents downregulated. The UCB shows almost global downregulation, or attenuated upregulation of genes involved in phagocytosis, chemotaxis and activation after LPS exposure. Whereas, the adult favors a more upregulated transcriptomic profile.

