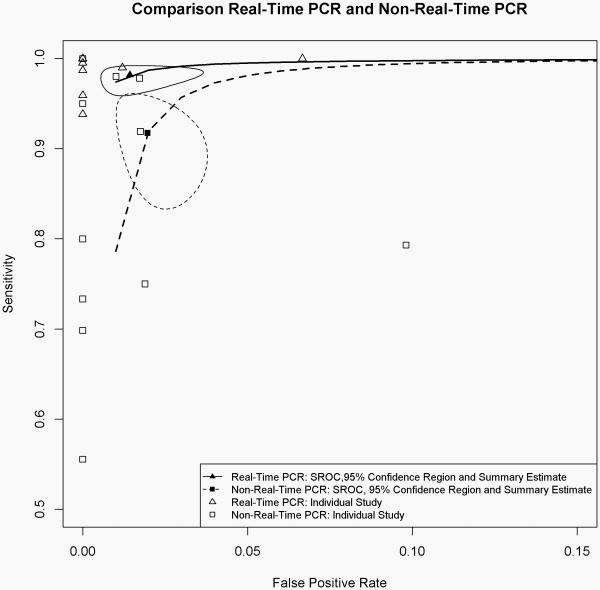
Figure 3.
Summary operating characteristic curves for sensitivity and specificity comparing studies using non-real-time PCR and real-time PCR techniques for the determination of the gyrase A genotype. Solid and dashed circled areas represent the 95% confidence regions for studies using real-time PCR and non-real-time PCR techniques, respectively.

