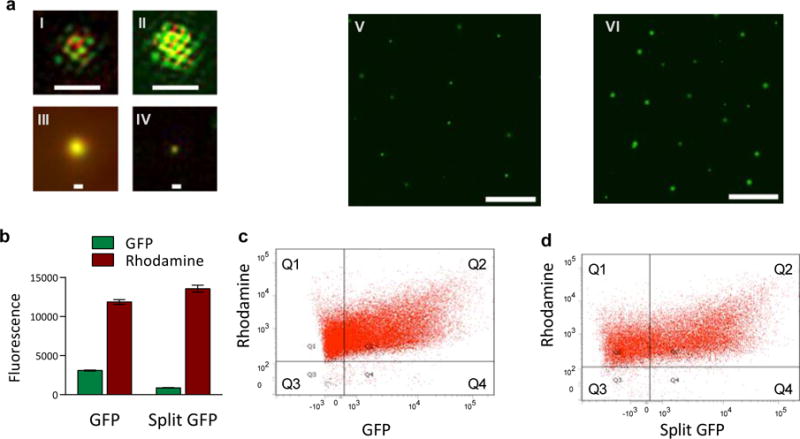
Fig. 2. Molecular confinement of multicomponent genetic cascades.

a. Images of liposomes expressing GFP. Sub-panels I–IV: structured illumination microscopy (SIM) images of representative liposomes expressing GFP and membrane-labeled with rhodamine. Every SIM image (panels labeled I, II, III, IV) represents a separate liposome; all liposomes were imaged on the same day and all liposomes came from the same sample, prepared 24h before imaging. All SIM images in this figure are at the same scale; the large scale bars in panels I and II are 1 μm, the small scale bars in panels III and IV are 200 nm. Sub-panels V–VI: widefield epifluorescent images of liposomes expressing GFP. The liposomes for this imaging sample were extruded through a 2 μm filter and dialyzed with a 1 μm membrane; panel V shows sample after 6 h incubation and panel VI shows an aliquot of the same sample after 24 h incubation. The scale bars on panels V and VI are 10 μm. b–d. Fraction of synells expressing GFP and split GFP, measured by flow cytometry (for control flow cytometry experiments, see Fig. S2). b. Bulk expression of GFP and fluorescence measured on the sample prior to the flow cytometry experiments. c. Analysis of samples expressing GFP; 68.4% of liposomes produced measurable green signal. d. Analysis of samples expressing split GFP; 61.8% of liposomes produced measurable green signal.
