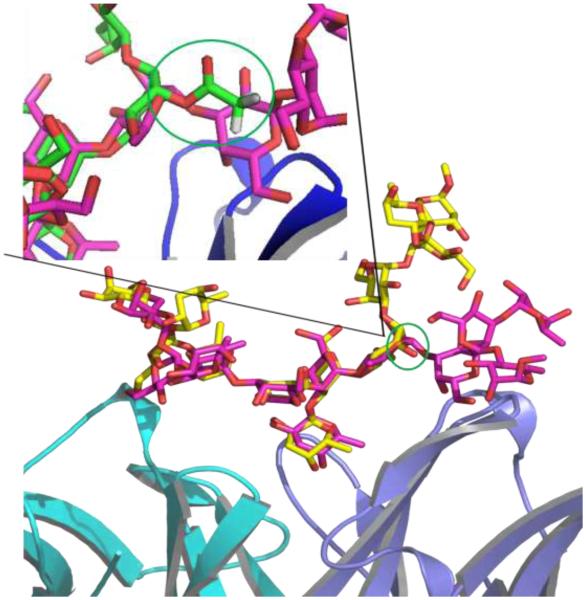
Figure 3.
Structural model of two representative carbohydrate conformations identified from GL clustering analysis of the antibody/de-acetylated saccharide system. Cluster 1 conformation is colored in purple and cluster 2 in yellow with oxygen atoms in red. The antibody is shown in cartoon and the saccharides in stick representations. The circled group corresponds the O-acetylated site in rhamnose(5) in the antibody/O-acetylated system. The inset highlighted the position of the acetyl group in rhamnose(5) with respect to the Cluster 1 conformation.

