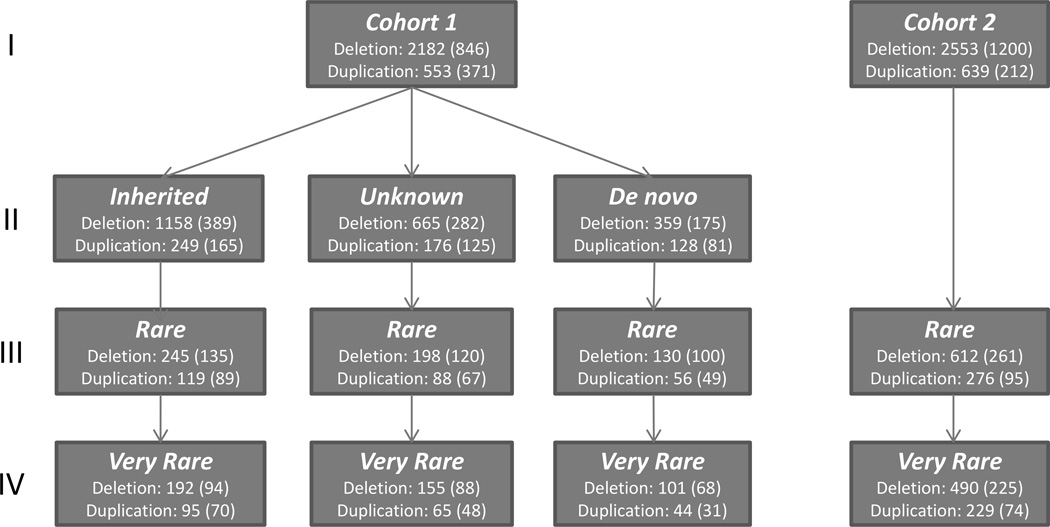
FIGURE 2. Flow chart depicting the distribution of CNVs in each cohort.
The total count of CNVs and in parenthesis, the subset of CNVs containing genes, are presented. Row I reports all CNVs; Row II describes inheritance status for Cohort 1; Rows III and IV report the number of rare and very rare CNVs as defined in Methods, respectively.

