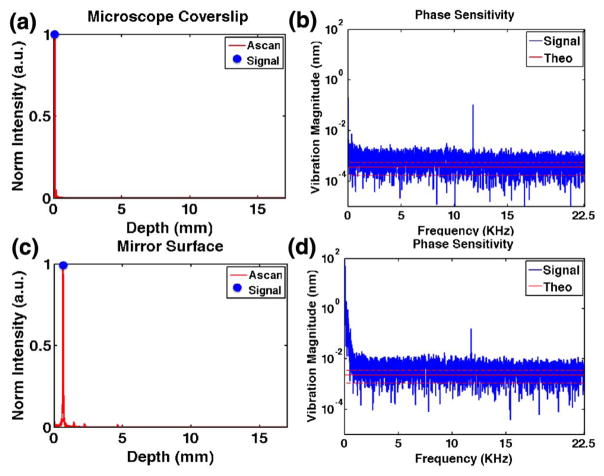
Fig. 2.
Phase sensitivity of VT-DBR swept laser. A-scans of a microscope coverslip autocorrelation (a) and a −40 dB reflector (c). The phase signal in the frequency domain from the peak signal [blue dot in (a) and (c)] based on a 10,000 line M-scan. The mean and standard deviations of theoretical phase noise are shown as solid and dashed red lines, respectively.

